Secrets to Help You Succeed in B2B Content Marketing
Looking for a smart way to sell your stuff and make meaningful connections with your business partners at the same time? B2B content marketing might be your golden ticket. All you have to do is create content to read, watch, or listen to that’s helpful and interesting for your audience.
The best part is that while your audience is enjoying your content, you’re also showing off your products or services. You’re not just selling stuff– you’re also building strong relationships with your customers, and that goes a long way.
Quick Takeaways
- B2B content marketing is about businesses communicating with other businesses, often with more detailed content that focuses on the logic of the product or service
- High quality content is crucial in B2B marketing as it helps businesses share their knowledge, show their expertise, and build trust with other businesses
- The top three content marketing priorities are creating engaging content, gaining a better understanding of what content is effective, and finding better ways to repurpose content
- B2B content marketing strategies should include a variety of content types like social media posts, newsletters, white papers, eBooks, articles, guest posts, and case studies
B2B content marketing is a powerful tool that can help your business stand out, build strong relationships, and grow in your industry.
What Is B2B Content Marketing?
B2B content marketing is a way for businesses to share information with other businesses. It’s like having a conversation, but instead of talking, you’re using things like:
- Blog posts
- Social media posts
- Videos
- Research reports
- Ebooks and whitepapers
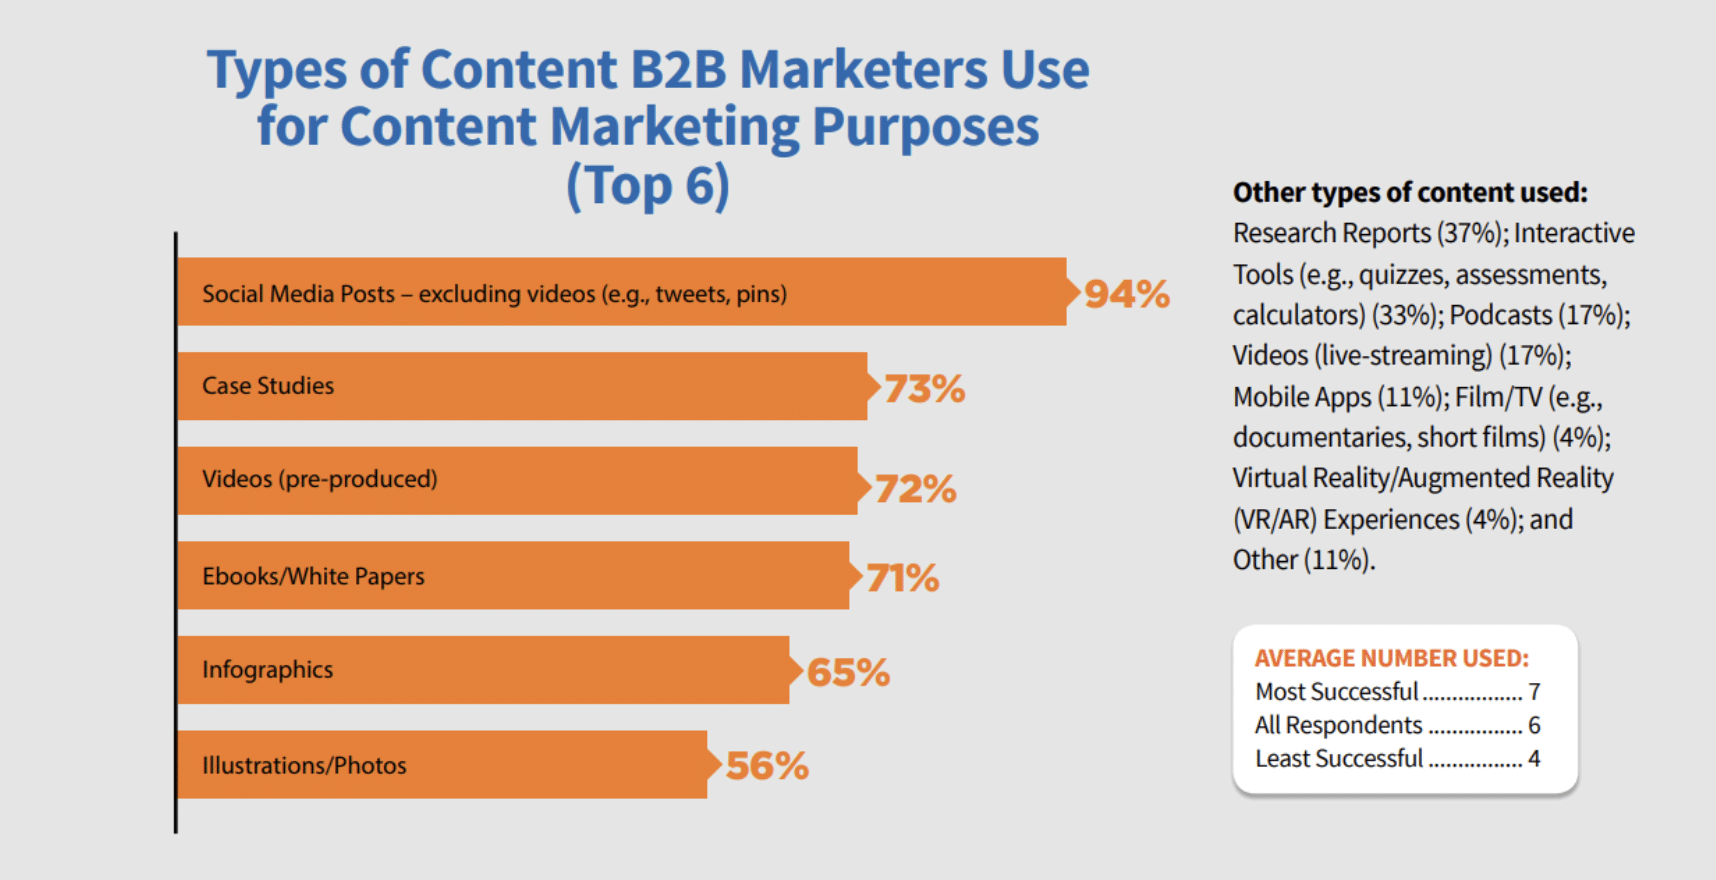
Image Source: Content Marketing Institute
The goal is to grab the attention of other businesses and make them interested in what you have to offer.
B2B content marketing is about creating and sharing useful content to help other businesses. It’s not about selling directly, but about building relationships and trust. By sharing valuable content, you can become a go-to resource for these businesses. This can help you build strong relationships with potential customers and can lead to more sales in the long run.
Understanding B2B Content Marketing
To fully grasp B2B content marketing, it’s important to understand how it differs from B2C content marketing. B2B stands for “business-to-business”, while B2C stands for “business-to-consumer”. In B2B content marketing, businesses are talking to other businesses. In B2C content marketing, businesses are talking directly to customers.
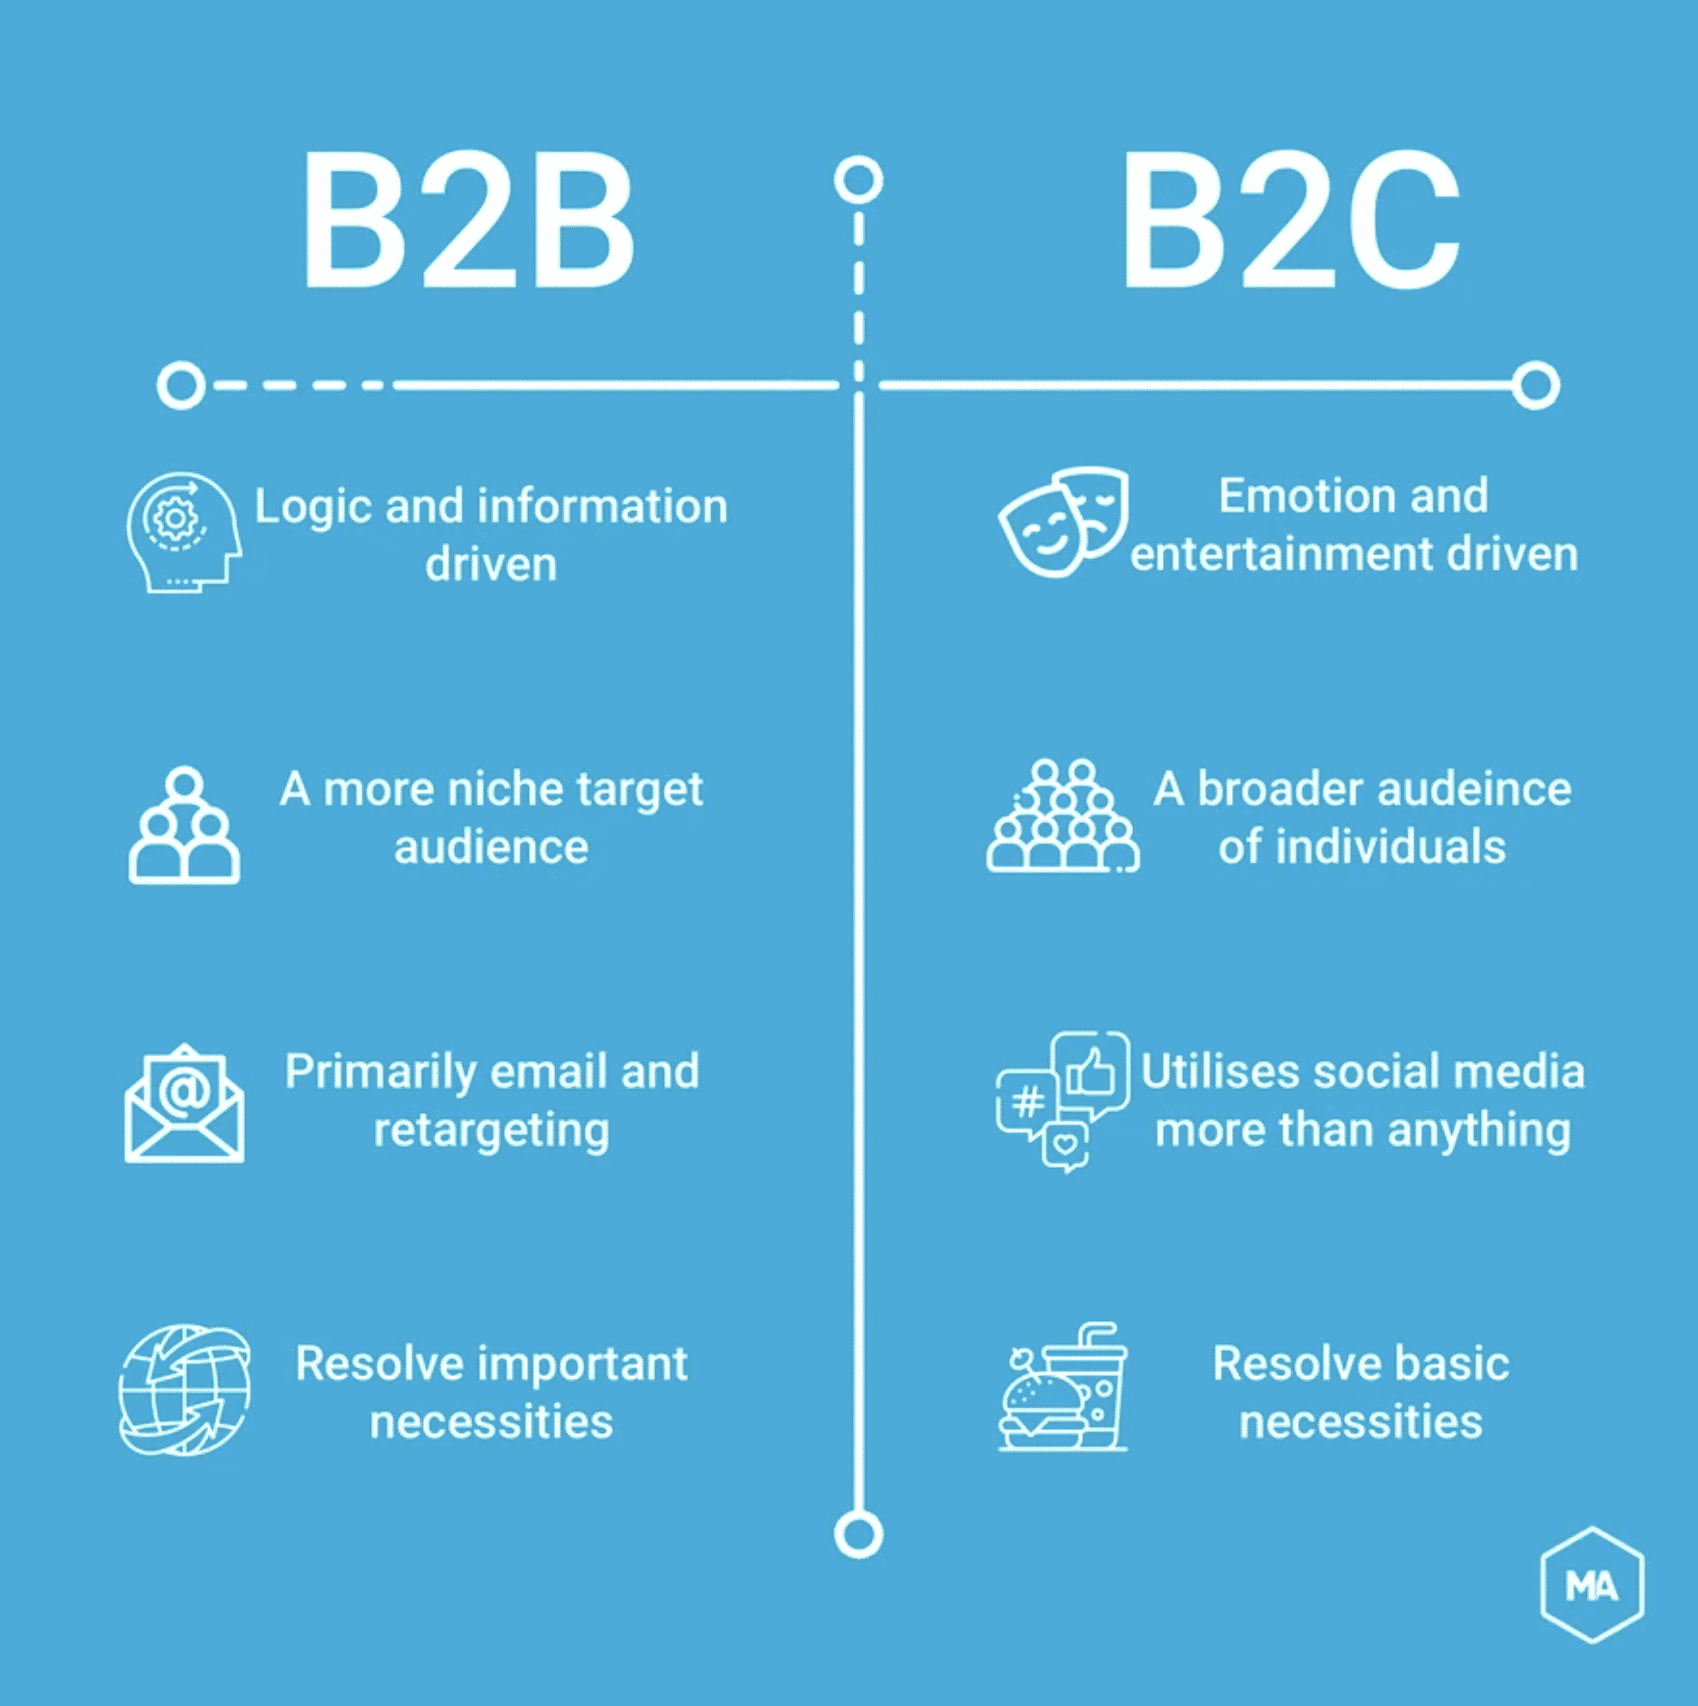
Image source: MarTech Alliance
The main difference between B2B and B2C content marketing lies in the audience and the type of content. B2B content is often more detailed and focuses on the logic of the product or service. It’s about helping other businesses solve problems or improve their operations.
On the other hand, B2C content is usually more about the benefits of the product or service and how it can improve the customer’s life. It’s usually more emotional and personal.
The Role of Content in B2B Marketing
High quality content is the heart of B2B marketing. It’s how businesses share their knowledge, show their expertise, and build trust with other businesses. Without content, it would be hard for businesses to connect with each other and build strong relationships.
When it comes to effective B2B content marketing, there are 4 main elements that make a strategy work:
- Target Market. Knowing who your potential customers are is the first step in any marketing strategy. In B2B marketing, this often means understanding the needs and challenges of other businesses in your industry.
- Product or Service Offering. This is what you’re selling. It could be a physical product, a digital product, or a service. The key is to make sure it’s something other businesses need and will find valuable.
- Value Proposition. This is the unique value your product or service offers. It’s what makes you stand out from the competition. In B2B marketing, this often involves showing how your product or service can help other businesses save time, reduce costs, or improve their operations.
- Sales and Marketing Strategy. This is how you plan to reach your target market and convince them to buy your product or service. It involves things like content marketing, SEO, social media marketing, and email marketing.
Top Priorities & Unique Challenges for B2B Content Marketing
Unlike B2C marketing, B2B companies have the unique challenge of not always being present in the eye of the customer. When you’re at the grocery store, you see products representing thousands of brands and companies lining the shelves.
There are advertisements every several minutes on TV and on nearly every other page of a magazine. Restaurants’ signs serve as glowing billboards, attracting customers to come in and dine.
While B2B companies do often post advertisements in industry-specific magazines that their audience may read or a billboard here and there, they do not have as many options in the physical space.

Of course everyone in the Bay Area knows about this billboard from Box. I’m sure they won a ton of customers from this investment (PS – sarcasm!)
That’s why in B2B, we need to take advantage of the digital space through content marketing. The top three content marketing priorities identified by B2B marketers, according to the Content Marketing Institute are:
- Creating more engaging content (72%)
- Gaining a better understanding of what content is effective (65%)
- Finding better ways to repurpose content (57%)
I have talked a lot about visual storytelling as the future of content marketing, so it is no surprise that visual content is becoming a top priority for marketers, coming in at number four (51%). Illustrations and photos also saw the biggest jump in B2B content marketing tactic usage, from 69% last year to 76% this year.
The number one content marketing challenge faced by B2B marketers remains producing engaging content (60%), followed by measuring content effectiveness (57%) and producing content consistently (57%).
Some other interesting stats from the report:
- Search engine marketing (SEM) remains the top paid advertising method B2B marketers use to distribute and promote content, and is voted the most effective promotion tactic.
- 85% of B2B marketers say lead generation is the most important goal for their organizations, followed by sales (84%) and lead nurturing (78%).
- Sales lead quality (87%), sales (84%), and higher conversion rates (82%) are the three most important metrics organizations use.
Types of B2B Content
When it comes to your B2B content marketing strategy, you want to make sure you use several types of content and stay abreast of the trends in content marketing, so you can not only reach your audience through different channels but also offer them a variety of content that addresses all of their needs.
Social Media
While LinkedIn is known as the “professional” social media platform and is for B2B companies that offer professional services and products, you should not limit yourself to just this platform. Take advantage of any social platform that makes sense:
- Snapchat
- Any other social platforms that are popular in the countries in which you do business
Your audience may have a personal, professional, and/or business account on social media that they can use to follow you. They may see your posts after work hours when they’re active. You’ll be establishing a relationship and creating a presence so that when your type of products or services are needed, they will defer to you first.
Newsletters
Another great B2B marketing channel is email, and you’ll want to push these during the work day (hopefully your audience has signed up with their company email). Newsletters can do everything from promote your latest blog post or case study, talk about upcoming seminars or webinars, serve as a mini-article, and more.

Image Source: Yesler
One of the most appealing things about newsletters is that you know this content is desired because your audience requests to be sent it. And you don’t have to limit yourself to just one newsletter, either. You can have newsletters (weekly, monthly, quarterly) that cover different topic areas important to your audience.
This allows you to be more specific in your newsletter content and helps you target a larger span of your audience, namely those who are looking for content that is more narrowly focused.
White Papers
White papers need to be some of your best content. It needs to be well researched and sourced, and it must be informative and useful for your audience. They will tend to run about 5 to 10 pages long.
As a business-to-business company, you want to be seen as an expert on a certain topic, the provider of the best product in the market, or highly experienced in a certain service area.
Writing white papers will help establish this credibility, and it can also be used to drive people to your website by sharing it on social media or through email. Another great benefit of white papers is that you can break it down into smaller pieces. Use portions of previous work to create a new article or take a snippet and turn it into an image for social media.
Ebooks
Like white papers, Ebooks will be some of the best content that you provide. The difference is in the length, with Ebooks being 10 pages or more. These are going to take even more time to research, write, and edit. You can publish as many as you want, but a minimum of two per year is good for most companies (if you have the resources to do so).
Similar to white papers, publishing Ebooks will help establish credibility and expertise in your audiences’ eyes. And also like a white paper, you can break it down into smaller content. Use portions to create a white paper or two, develop some articles, and make content for social media.
Articles
If you have a blog, you’ll want to make sure you are updating it with new articles each week. The bigger your company, the more likely you are to be able to devote resources to generate articles on a more frequent basis. But at the very least, you need to post a new article once a week.
Cross-promote your articles by providing the opening paragraph in your newsletter or pulling a quote and using it as an introduction on your social post (be sure to provide a link!). You want to push your audience to your website and keep them there; the more they explore your website and learn about your company and its offerings, the better.
Guest Posts
Instead of only generating content for your website, consider creating guest posts for third-party websites. It will be additional work because you’ll want to make sure you continue to create content for your own website, but it can significantly benefit your company.
But when creating a guest post, don’t just submit to any website: Be sure to conduct research for high-value websites that have a lot of foot traffic and are related to your company in some way. The benefits of guest posting include:
- Expanding your reach beyond your audience
- Garnering new interest from another website’s audience following
- Have someone else promote your content
Know that guest posting will take more effort because not only do you need to find the right website but for nearly all guest posts, you will need to create and submit a pitch to the website prior to writing your article.

Image Source: Hubspot
Something else you can consider is answering posts to be a source (such as through Help a Reporter Out) or to conduct an interview. Have your CEO, a Vice President, or other head serve as the interviewee. Their name will be associated with your company, and by providing helpful information, you will benefit those who may be interested in your products or services.
It’s also less work on your part because you do not have to worry about pitching, researching/writing, and publishing the piece. All you need to do is provide the information!
Case Studies
If you want to show off your experience, case studies are a great way to do it. It’s another form of content that you can host on your website, use in pitches or proposals, and share across a variety of channels.
But the main benefit of case studies is that you are proving your capabilities, whether you sell a product that can help businesses or provide a special type of service.
Check out our amazing case studies here! To see a B2B content marketing case study in action, watch the video below.
Video Source: Andrew Davis
User Generated Content (UGC)
You read that right. Primarily a B2C marketing tactic, B2B brands can achieve just as much, if not more reach from the UGC pot of gold. The trick is to view UGC as more of a collaboration than a wildfire social campaign – how can the customer and the brand work together in a way that both win?
In today’s customer-centric marketing model, encouraging consumers to publish content on social media – sharing their brand experiences and personal stories – has become one of the most powerful tools for engagement.
UGC isn’t limited to social sharing. It includes online reviews, brand advocate blog posts, videos, testimonials and charts posted on online forums and websites. According to a Comscore study, when marketers combine user-generated content (UGC) or employee-generated content with brand content, engagement can spike by as much as 28%.
3 Questions to Help Formulate a B2B Content Strategy
Andy Rogerson, Founder of Grist, recommends that every B2B marketer should ask themselves the following questions before setting their content strategy in stone.
1. Why do you produce content?
Questions don’t come more basic than this. When asked, many firms struggle to come up with a coherent answer beyond, ‘It’s what we’ve always done’, ‘It’s part of the marketing mix’, ‘Our competitors do it, so we should too’ or ‘People would notice if we stopped’.
It may come as a shock but the world isn’t waiting for your next piece of content. Words without purpose rarely generate interest.
Content must have a mission, an objective that reflects business goals. That doesn’t mean writing about how wonderful your products or services are but it does mean defining differentiation, or taking the ‘What do we want to be famous for?’ test. In a competitive landscape – where some rivals will have greater resources to draw on – that means going to your niche and articulating a content mission to match.
Prioritizing certain sectors or themes means accepting that other areas will be downplayed. And that’s fine. It’s key to the strategy, bringing clarity to your offer and to your message.
2. Do you (really) know what your clients want?
Knowing what your organization wants is only half of the equation, of course. Knowing what your clients want is the other half. It means asking them and observing how they interact with the content you already provide to assess what works and what doesn’t.
Knowing what your clients want is not just about listing their topics of interest. It’s about understanding the challenges they face, their changing needs across the buying cycle, their circles of influence, the formats they prefer and even the days of the week and times of day they seek out the type of content you might provide.
Our Value of B2B Thought Leadership survey looked at the wants and needs of the C-suite working in FTSE 350 companies. Some of the results might surprise – such as a preference for short-form, text-based articles over video and other multimedia bells and whistles – but the underlying message ought to come as no surprise.
Senior executives want thought leadership that helps them stay ahead of emerging trends (66%) and helps them make better, more informed decisions (60%). Does your content deliver on either? If not, rewrite, recommission, rethink.
3. Do you know where content fits into the business development process?
In fact, there’s a more fundamental question that precedes this one – do you fully understand the business development process? If not, it’s time to find out and then apply the B2B content marketing strategy to it.
This means thinking about what information your audience might need at any given stage, and creating and signposting helpful content that anticipates and answers their most pressing questions. If crucial links in this chain are missing or broken, the likelihood is they will look elsewhere.
Marketing facilitates a dialogue between those that sell and those that buy. In that context, content should be a major engagement tool, albeit not the only one. Get the narrative and the timing right and you can shorten and strengthen the B2B buyer journey.
Without addressing these three questions, your content will never do what you want it to do.
7 Secrets to Help You Succeed in B2B Content Marketing
According to a research from Eccolo Media, B2B buyers think much of the existing B2B content is too long, too general and has too much marketing hype around the B2B offering as well as their features and benefits. So what should B2B marketers do in their content? What’s actually considered effective content?
Lead gen expert Dan Stelter studied 100 B2B software and tech company websites to find out exactly what’s missing in B2B content that today’s consumers are looking for, and these are 7 insights you can leverage to boost your B2B content marketing efforts:
1. Ease Buyer Pain
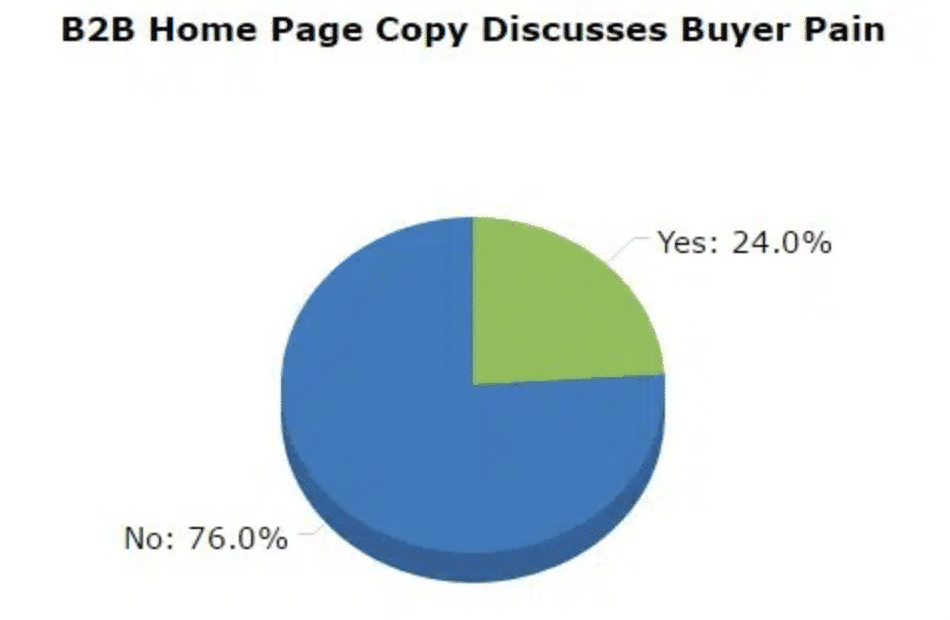
Stelter found that more than three-fourths of the companies he’s looked at did not adequately address their target audience’s pain points. And even those who did, the content was not compelling enough to make him feel like the pain points were adequately addressed.
This is a big missed opportunity since a survey conducted by Google, Motista and CEB found that B2B customers, compared to consumers, are much more emotionally connected to their vendors. This is because what’s at stake is higher for B2B buyers than consumers with their purchase decision.
With a product they’re not satisfied with, consumers can typically return them for a full refund or credit back. B2B purchases, on the other hand, do not work the same way. Given how costly these investments can cost (six or even seven-figure at times), B2B buyers on average have to work with anywhere from five to twenty decision-makers and stakeholders. And if they made a bad buying decision, it can cost B2B buyers their professional reputation, credibility and even their job.
By speaking to the pain points your target B2B buyers are facing, and acting as their strategic partner and advisor, you can more effectively stand out from your competitors, connect and engage with your customers through your content.
2. Remove Fear of Loss
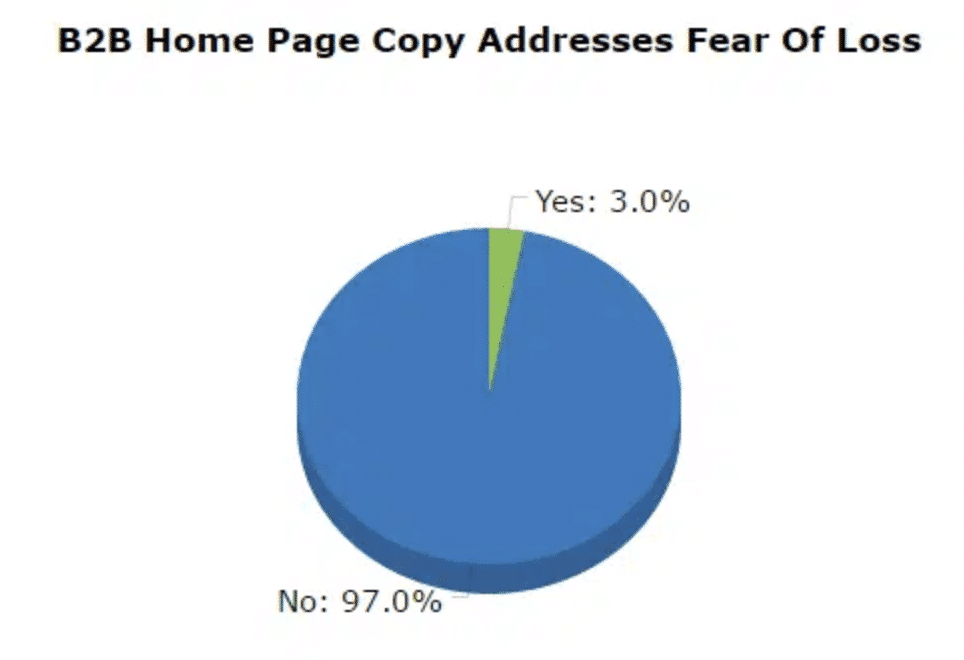
Fear of loss is a powerful motivator to drive people to take actions. And there’s even scientific research to back this up. The research suggests that, when something is framed as a loss, people are more inclined to take action to avoid pain and loss, even if the outcome at the end is the same.
But surprisingly, out of the 100 companies Stelter looked at, only three companies have discussed this on their company home pages.
When creating content then, think about how you can communicate the pain and loss your B2B offering can help alleviate, to make your content more effective and compelling.
3. Emphasize Features and Benefits
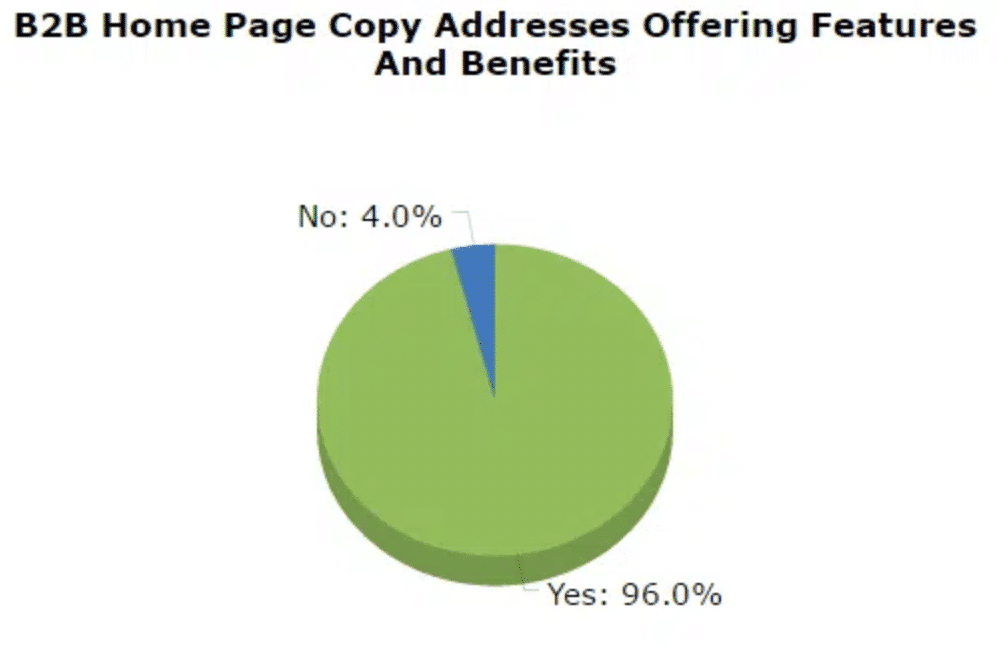
Stelter found that the company websites he’s looked at generally do one of these following two things: one, they discuss, on average, three to six of the major benefits and features of their B2B offering; and two, they briefly mention their benefits and features without highlighting them in detail.
Going back to the Eccolo Media study, most B2B buyers felt that today’s content is too focused on promoting the benefits and features of a product or service. These findings may suggest that B2B content focused on features and benefits isn’t as valuable to B2B buyers as what some brands and marketers may like to think.
4. Address Stakeholder Conflicts
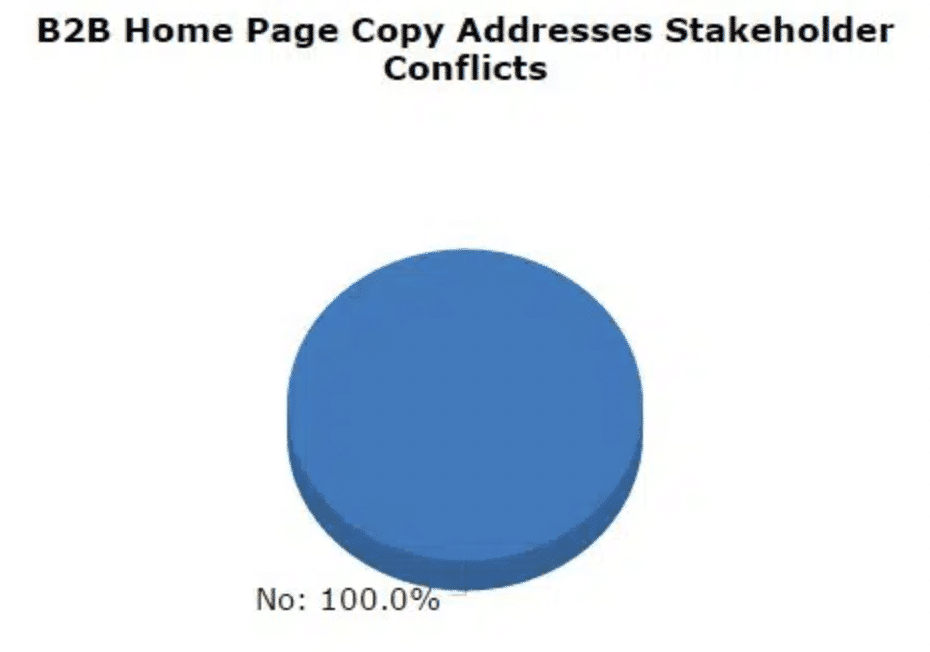
A big missed opportunity Shelter found was addressing stakeholder conflicts. Not a single company he looked at has discussed and provided solutions to managing these issues.
According to CEB research, most stakeholder conflicts arise early on in the buyer’s journey. What B2B marketers can do through their content is to help B2B buyers reach consensus, and this can be done by:
- Focusing on the common ground among multiple stakeholders by discussing shared topics and learnings important to them.
- Increasing rewards and decreasing risks for decision-makers who have more influence over the final purchase decision.
- Providing these decision-makers with the resources and tools they need to advocate for your B2B offering and influence others within their organization.
While you want to personalize your content so you’re addressing the stakeholder conflicts that are relevant to your B2B buyers, you also don’t want to personalize your messaging so much that it alienates the needs of other stakeholders who are involved in the decision-making process. Because when that happens, consensus can’t be reached and a final purchase decision won’t be made.
5. Underscore Benefits to the Business as well as the Individual Decision Maker
Stelter found that most B2B companies had compelling and relevant messaging around the benefits of their B2B offering to the business. The weaker company pages only offered generic benefits their product or service can provide to their target audience’s companies.
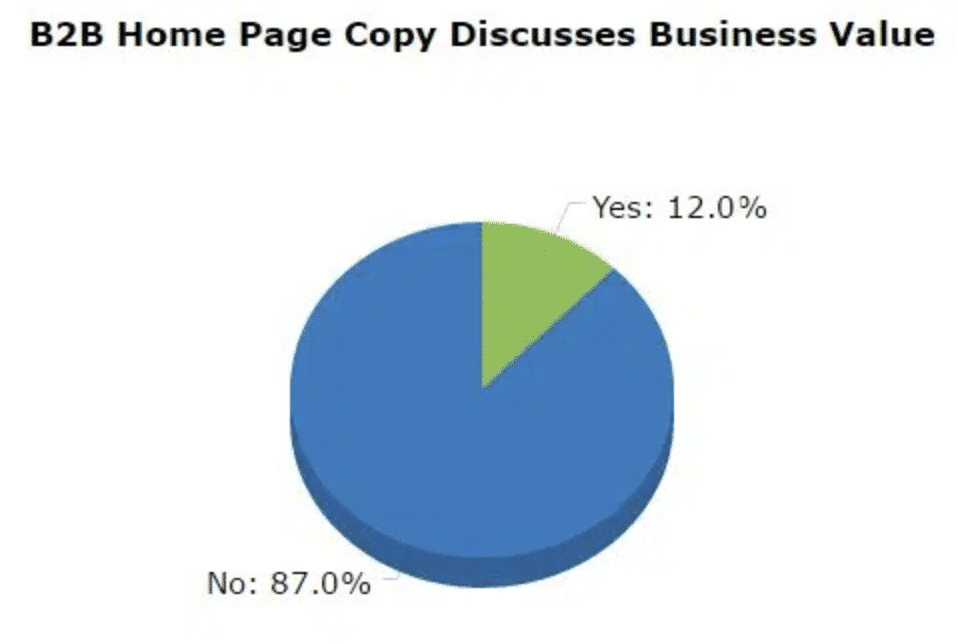
If you want to improve your B2B content, you’ll want to develop a deep understanding of your B2B buyers and the business benefits that are important and relevant to them. From there, think about how you can incorporate that messaging into your content as you’re developing it.
To improve your content effectiveness, you’ll need to address and highlight personal value in addition to the business benefits your B2B product or service can offer to a B2B buyer’s organization.
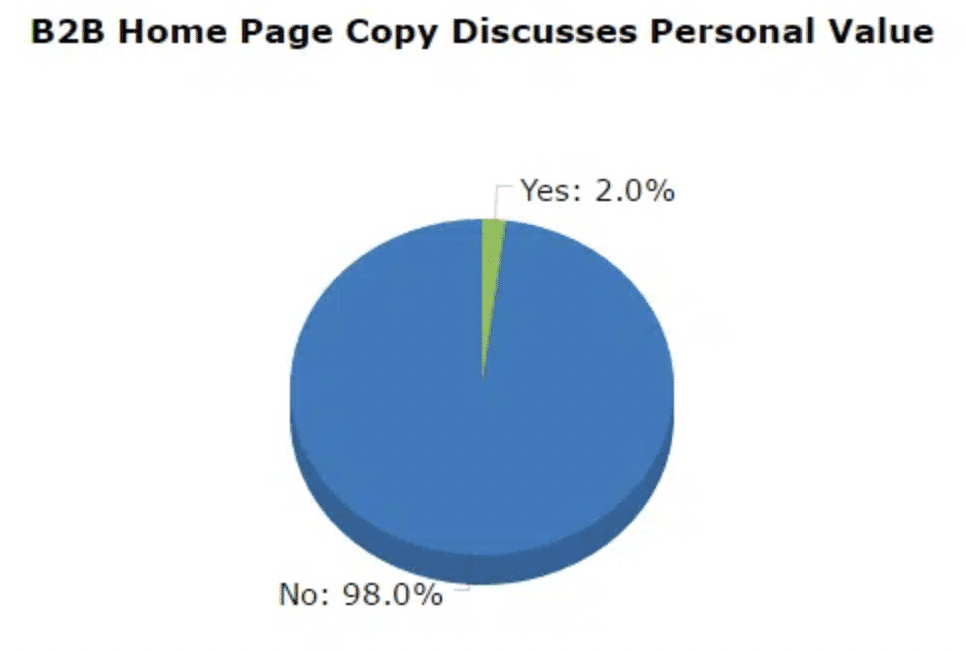
There’s a common perception among some B2B marketers that B2B purchasing decisions are made solely based on reason and logic, because business is not supposed to be “personal.” But the reality is that personal benefits can and do play a central role in how B2B purchasing decisions are made.
According to Kapost, personal value has twice as much impact as business value does. 71% of B2B buyers who see personal value in a B2B offering will purchase the product or solution. And, 68% of B2B buyers who see a personal value in a B2B offering are willing to pay a higher price for it. In contrast, only 8.5% of B2B buyers who see no personal value will pay a higher price for a B2B offering.
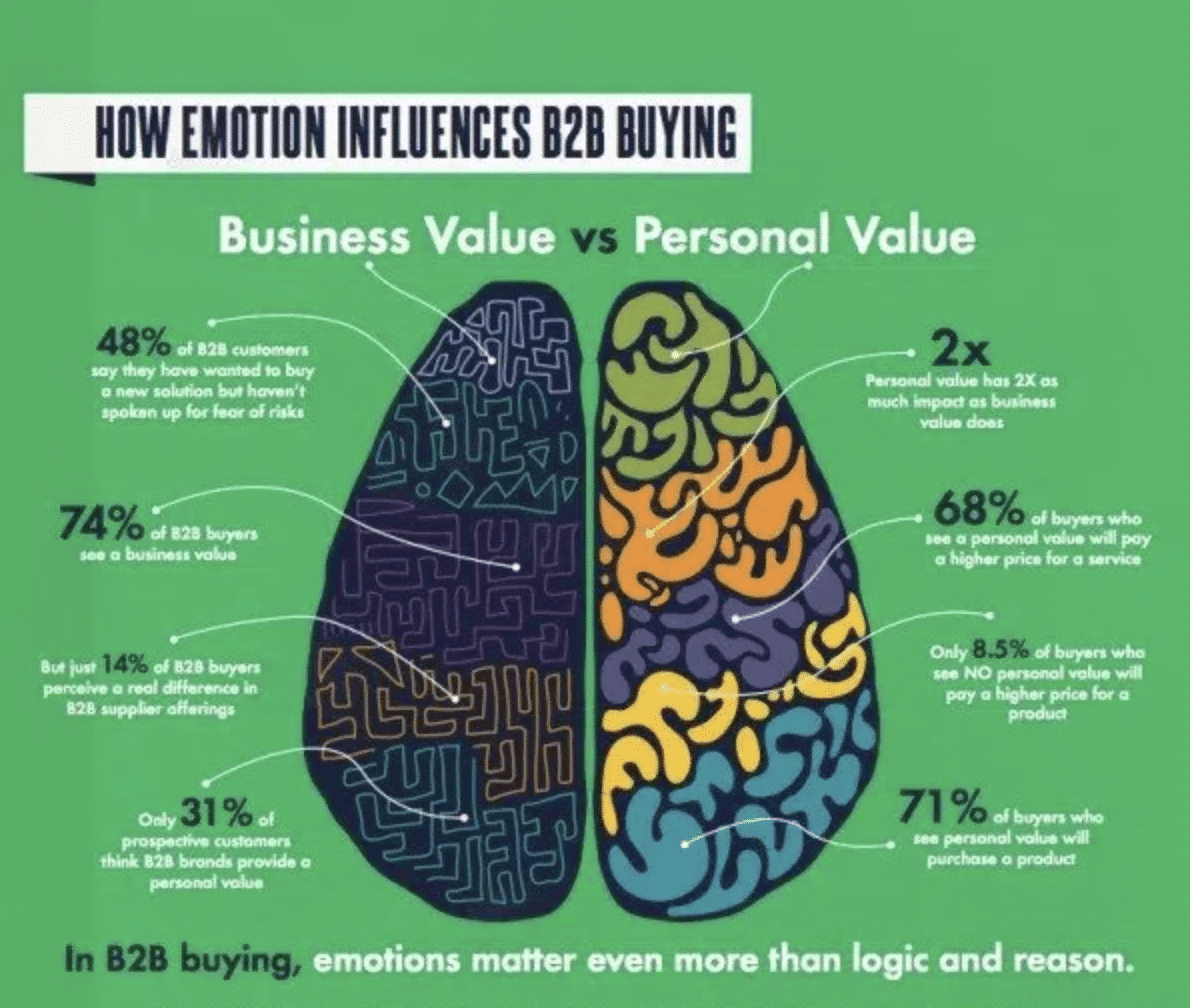
Image Source: Executive Board
6. Document Your Strategy and Communicate Progress
CMI’s B2B Content Marketing Benchmark Report finds year after year that there are four key things the most effective content marketers do differently compared to their peers:
- They understand what successful B2B content marketing looks like.
- They document their content marketing strategy.
- They develop and document their editorial mission statement.
- They regularly discuss their content marketing strategy and program with their team.
61% of most effective B2B marketers say their teams meet on a daily or weekly basis to discuss progress and results of their content marketing activities. More than 50% of respondents say they find their internal content marketing meetings very or extremely valuable in helping their organizations become more effective at B2B content marketing.
While many studies in the past have shown the positive impact that documenting their content marketing strategy has on content marketing success, only 32% of B2B marketers reported that they document their marketing content strategy.
Content marketing success also increases for organizations who have a documented editorial mission statement. 48% of the most effective B2B marketers say their organizations document their editorial mission statement.
7. Know the Demand Generation Process
According to the CMI benchmark report, when listing their top goals for content marketing, 82% stated Engagement was the most important. Following close behind were the following:
- Sales: 81%
- Lead Generation: 79%
- Customer Retention/Loyalty: 74%
- Lead Nurturing: 74%
- Upsell/Cross-Sell: 65%
While these are all great goals, they are also all a part of Demand Generation. You cannot have effective demand generation without lead nurturing. Carlos Hidalgo, Startup Advisor, Ex CEO at ANNUITAS, and author of The UnAmerican Dream, has this to say:
“Demand Generation is also a practice of marketing and sales. And demand generation is not just about the acquisition of new customers. We need to apply the same principles of demand generation to the existing customer base to keep them engaged. This is significant to help turn our customers into advocates, which is oftentimes, one of the most overlooked areas in most organizations and an area where content marketing is essential.”
If B2B marketing organizations want to increase their success in content marketing, defining strategic demand generation that will Engage, Nurture, Convert buyers/customers will go a long way.
Start Succeeding in B2B Content Marketing Today
Everyone in the B2B content marketing world seems to be all about content creation these days. But in order to be successful, you need to have a data-backed strategy, especially when the big bosses are watching the results like hawks.
So, if you’re a marketing leader, it’s time to step up. Stop the random content toss and start really understanding your buyers and customers. Make content that fits their needs and keep making adjustments to make it better. That’s when you’ll start to see some real magic happen with your content.
If you’re ready to get more traffic to your site with quality weekly blog content that’s published consistently, you’re in the right place. Get started today by checking out our weekly blog content service, or schedule a free consultation now to learn more!


Get a Free Consultation
for Content Marketing