![7 Steps To Create Awesome Infographics [Infographic]](https://marketinginsidergroup.com/wp-content/uploads/2023/09/Amazing-IGs-1-1024x1024-1.png.webp)
7 Steps To Create Awesome Infographics [Infographic]
An infographic about infographics? So meta, right?
Infographics are one of the most popular ways to share and communicate information in a visually interesting way.
Every year you read new reports about how visual content is more engaging to readers than text-based content. Today’s audience prefers and responds better to visual content than plain text alone. The data is pretty compelling, actually. Especially when it comes to infographics.
- Colored visuals increase people’s motivation to read a piece of content by 80%.
- Infographics are liked and shared on social media 3 times more than other any other type of content.
- Publishers who use infographics grow their traffic an average of 12% more than those who don’t.
You know that infographics work well to engage readers, make your content more memorable, and get more shares and likes on social media. And this is why visual content like infographics has become an important component of content marketing.
But not all infographics are created equal. For every truly stunning example of great design and content, several bad and confusing infographics exist. To keep your content from falling into the substandard category, I lay out the key elements and steps for creating amazing infographics here…
1: Ideate
Start by considering the business side of your infographic creation. Your marketing, creative and business teams need to work together to brainstorm and decide on an idea for your infographic.
Begin with a pool of 8–10 ideas. Research each to find other content and information on your chosen topic, and look to see if there are other infographics out there that have already covered your idea. If so, what additional information and value can your infographic offer?
2: Gather the Data
Once you’ve decided on your idea, you’ll need to compile the data that your infographic will illustrate. As fun as infographics are to read, they really are all about the data. The data you choose will guide all of the content – from copy to graphics.
So first things first. What data do you want to share with your audience?
- A research report with findings that would be meaningful to your customers.
- Survey data you collected that would be interesting to readers.
- A process or policy you want your audience to better understand.
- Key takeaways from a presentation.
- Publicized results from an industry report or survey.
Infographics can (and should) be fun! Starting with the data doesn’t mean the infographic has to be academic or boring.
Just make sure if you’re citing data from other companies and organizations, you link to the original source in your infographic. Most people include the list of sources as footnotes or endnotes.
3: Weave the Story
Data is just information until you put it in context. So once you’ve decided on your data, you need to begin creating that context for your readers with a story.
Sometimes the data tells a story all on its own. Startling statistics don’t often need a lot of copy to introduce their meaning to the reader. But more often than not, you’ll need to paint the picture with an engaging story.
First, decide if you’re educating, inspiring, entertaining, or informing the reader. Once you have that end-goal in mind, decide what specific pieces of the data will help you tell that story best.
Like any good story, your infographic will need a beginning, middle, and end. To make sure you’re telling a compelling story from the beginning to the end of your infographic — one that links facts, figures and visuals together — take the time to plan out the structure and writing of your infographic’s content. Write a brief intro, let the data do the heavy lifting to tell the story in the middle, and then wrap up the infographic with a conclusion that includes a CTA (call-to-action).
Of course, not every infographic needs a CTA – but if you’re creating an infographic as a marketing tool, you’ll want to include one.
Here’s an example from the New York Times that beautifully illustrates the story of Japan’s new Himawari-8 weather satellite and its 144 photographs of our planet per day.
4: Bring It to Life With the Right Visuals
You have all the content ready to go and you know how you want the reader to interact with your infographic. Now it’s time to bring it to life with a visual theme.
Many businesses stick to their branding when they design their infographics. And there’s certainly value in the consistent experience that brand visuals bring to the table. Just don’t forget your customer in this situation.
Make sure the visual design of your infographic will speak to your customers, first and foremost. The visual structure of your information should be clear and logical, and the writing should communicate with your audience in a way that best resonates with them.
Orientation And Visual Hierarchy: Almost all websites use vertical orientation and it’s easier to view on mobile phones. Think hard before you choose horizontal. Then create your visual hierarchy. The infographic needs focal points that the rest of the design complements.
Colors: Did you know that colors account for 85% of the reason why people make a purchase? In fact, when people watch just three seconds of an ad, 62% of them have already made their decisions about the brand based on the colors displayed in the ad. That’s why choosing the right colors plays an extremely crucial role in the success of your infographic.
Fonts: After choosing your color scheme, it’s time to pick the right fonts for your content. Fonts make or break your infographic’s readability. The right font choices add ambience and personality to your infographic, while the wrong font choices clutter the page and obscure the information. If you have the resources, it’s worth getting your graphic designer to experiment with a few different fonts to see which ones best support the creative direction of your infographic.
5: Get Interactive
By definition, interactive means two people or things influencing or having an effect on one another. It also means a two-way flow of information. But to really create that dialogue – that two-way flow of information – you need to involve the reader’s real-time input.
Making your infographics interactive can actually help you create a two-way dialogue between you and your customers. An interactive infographic is one that combines the graphics and data of a standard infographic with interactive elements like animation, video, surveys, and polls.
Truly engaging interactive infographics ask the reader to do something. To enter information or make a selection. This way, they’re engaging with the content, instead of just reading your infographic and/or absorbing the visuals. In other words, you’re not just visualizing the data for readers, you’re helping them participate in it.
The simplest action is when the reader is asked to choose an area to focus on navigate through the infographic. It’s a simple request, and one that doesn’t require much cognitive energy for the reader – but it gets them directly engaged in the infographic.
6: Promote with a Plan
You want your target audience to actually see and engage with your final work. That’s why you need to find the perfect places to debut and distribute the infographic.
Think about all your owned and paid content destinations and social media channels you can leverage, as well as influencers you know who could potentially work with you to help amplify your content.
You’ll also need other elements, like promo snippets from the content, to market your new infographic. Make a list of what you’ll need before the infographic is finished so that you’ll be ready to get a jumpstart on your marketing as soon as the content is complete.
7: Set Your ROI Goals
Make sure you set return on investment (ROI) goals for the infographic, if you haven’t already done so in the planning phase. You want to be able to measure whether your infographic has met your objectives or not at the end of your campaign, so you can demonstrate your ROI to the leadership team.
If you’ve got Step 5 right and created an interactive infographic, you can gather valuable information about your audience that you can feed back into Step 1. Once you have your data and you’ve decided what story you want to tell with it, you’ll need to decide what interactive elements you want to add.
To zero in on the right elements, ask yourself these three questions:
- What conclusion do you want the reader to come to at the end of the infographic?
- What more information does the reader need to know?
- What information do you need to know about your customers?
For example, if your goal is to increase leads, you want to make sure that you have included a call-to-action within your infographic to contact your company or complete a lead gen form for access to additional resources. This way, you can measure the number of leads your infographic is generating.
If you’re missing even one of these key elements, your infographic might struggle to succeed. You might end up with a great infographic but no marketing plan, a pretty infographic representing a terrible idea, or a fantastic idea but shoddy design work.
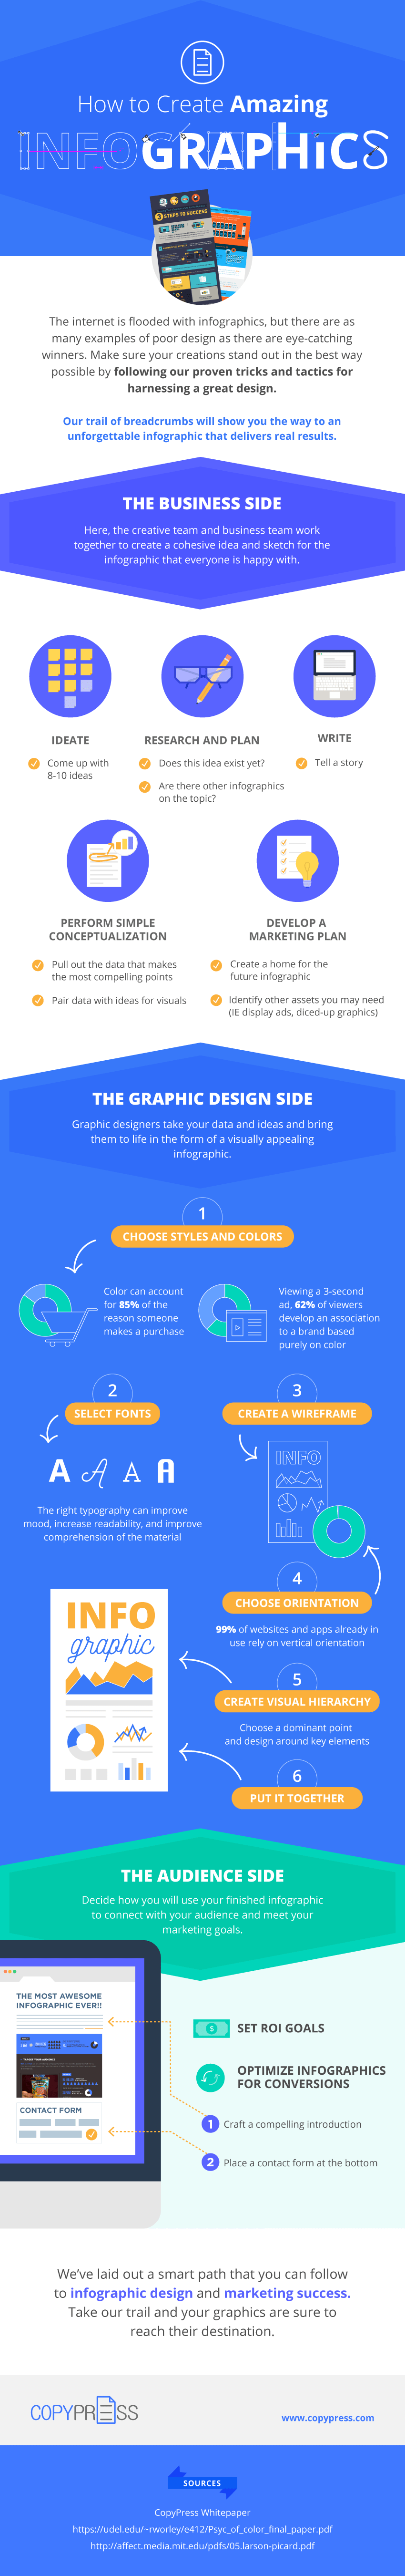
Check out this infographic about infographics from CopyPress below:
Create an Infographic Your Customers Can Sink Their Teeth Into
Animated infographics used to be the sole residents of the “interactive infographic” category.
But oh, times have changed.
Now you can create infographics that really get readers involved in the story you’re telling with the data, I’ll keep you on the topic by pointing you to some more examples of engaging content that include really good visuals.


Get a Free Consultation
for Content Marketing