5 Keys to Analytics: Improve Your ROI with Better Insights
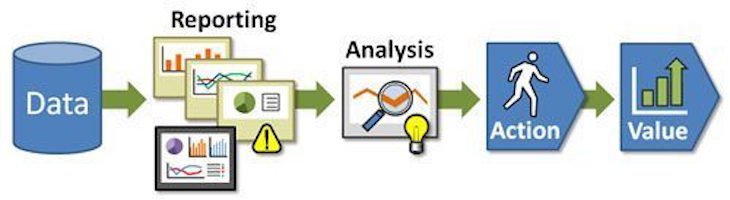
Take a good look at the graphic above, courtesy of Adobe. In it, you see that data translates into value, such as improved ROI, but only when viewed through the lens of analysis and translated into action. So, what are the keys to analytics that produce ROI?
Keys to analytics #1. Deriving insights
The #1 key to analytics is deriving insights from the data. But data is just a bunch of numbers, words, and images. And, we produce tons of it every year. In fact, we produce 2.5 quintillion bytes of information per day, on average. To put that in perspective, 90% of the data in existence in the world today was produced in last 2 years, according to IBM. Most of that data is unstructured, meaning it is something other than numbers: images, words, video. Analysis of unstructured data is particularly difficult.
Turning massive amounts of data, Big Data, into insights requires a process involving organizing or reporting and analysis to generate meaningful insights. Hence, data is useless unless you can accurately and validly transform that data into insights. Otherwise, data is a cost rather than a benefit: it costs money to collect and store data.
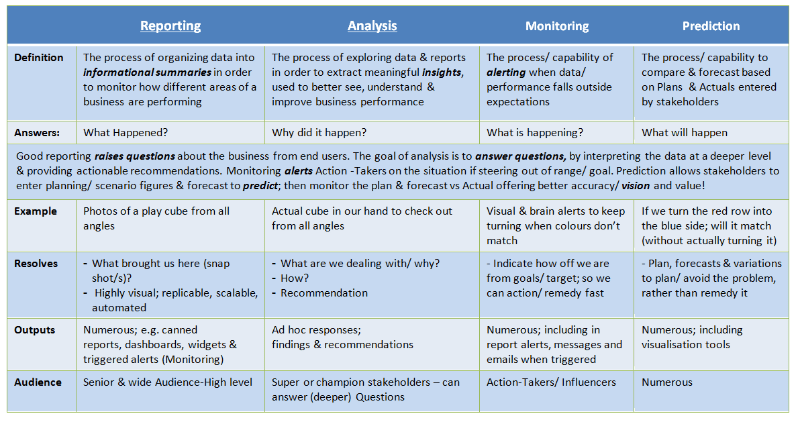
Take a look at this graphic to see a deeper investigation into the way data is processed to produce meaningful, actionable insights that translate into improved market performance.
Keys to Analytics #2: Combining data with concepts
But, data shouldn’t be analyzed in a vacuum. You need to incorporate data with existing knowledge structures to both guide the analyst on what metrics are important and to formulate actions from the data. Without subject matter experts involved in the analysis process and controlling how analysis translates into actions, the firm won’t optimize performance.
Let’s look at an example.
Say we have a ton of data from our e-commerce website. Here’s what an AdWords dashboard might look like viewed through Google’s Data Studio:
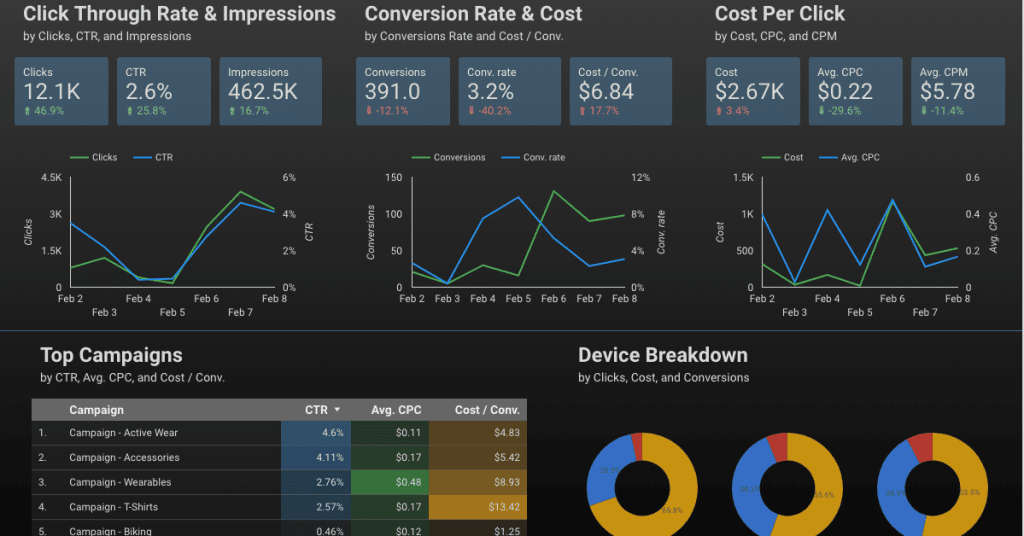
Data visualizations help us see more about what’s going on with our advertising campaign–something we’d never be able to do effectively by looking at columns of numbers.
We get valuable insights from this data including the best days to run ads based on cost, conversion, and clicks, the best performing ads, and devices used to get the ad. This is great information, but it’s not all that you’ll find if you combine this data with marketing concepts. Hidden within the short identifier of the ad, is information about customer attitudes derived from marketing theory that can guide better ad creation. Knowing that a high performing ad, for t-shirts, used humor, for instance, suggests that future ads might perform better if they use humor.
Keys to analytics #3: Using marketing concepts to create data gathering
You also need a good understanding of marketing concepts to construct tests that guide your data gathering efforts. A good example is looking at user experience data. Without a clear understanding of how consumers move through the decision-making process or what factors impact this journey, it’s hard to know what data to investigate further or to build into your A/B testing.
For instance, understanding that purchases are guided by the theory of planned behavior, which seeks to understand why people buy products as a function of norms and other factors when used with data, helps in constructing advertising campaigns or developing other marketing strategies. Using the theory of planned behavior, a researcher might construct an A/B test involving previously identified social norms then use data to see which drives purchases more strongly. Without knowing the theory, analysts wouldn’t even know to look at normative beliefs.
Constructing predictive algorithms also relies on an understanding of consumer theory. Without guidance from theory, you’re handing big data blindly and you’ll likely run into a bunch of spurious correlations, which a new book highlights as both dangerous as well as ubiquitous.
Keys to analytics #4: Ignoring qualitative data
All those fancy charts and pictographs and pretty images are very cool, providing an assurance of reality that they might not possess. Play a few tricks with the scale and transform a few data points and you’ve got lies masquerading as truth. We see it all the time. That’s what’s behind the old saying that there are lies, damn lies, and statistics.
A bigger problem is that those columns of numbers ignore up to 80% of the problem, according to IBM. By unstructured data, we mean all those words, images, and video that can’t be categorized through statistical analysis. Transforming this data into insights is currently one of the biggest data analysis problems out there, according to the IBM article linked above.
Because they can’t analyze unstructured data, analysts tend to discount its value. Which is a huge mistake. Unstructured data gives us important information about how people think, feel, interact with products in their environment, interact with friends and family, how influencers bend their decisions. They also share their problems, challenges, and aspirations, providing insights into unmet needs that offer great opportunities for innovation.
I have a friend working at Microsoft who found enough insights by analyzing criticisms of their recently introduced Surface computer, he was able to provide engineers with valuable guidance on improving the product within the first week after product release. That enabled Microsoft to speed an improved product to market and led to its dominance in the new market of tablet/laptops.
Keys to analytics #5: Constant monitoring
It isn’t enough to have a great analytics program in place. You have to monitor performance on a continual basis. For some businesses, that means gathering, structuring, and analyzing data in real time.
Take a look at the dashboard below. Here analysts monitor performance in real-time during a NASCAR race, so they can tweak messaging or craft social media posts based on the freshest data coming in.

5 Keys to Analytics: Improve Your ROI with Better Insights
MKT Maven


Get a Free Consultation
for Content Marketing