300+ Digital Marketing Stats to Drive Your Marketing Strategy
Navigating the digital marketing world is like surfing – you need to catch the right wave to successfully ride the trends. As we look ahead, the future of marketing is shaping up to be an exhilarating swell, filled with evolving challenges and opportunities.
Curious about where things are heading? Keen to see how your marketing playbook compares with the industry’s best? Or maybe you’re itching to find out the latest strategies keeping top marketers on their toes? Diving into the freshest digital marketing stats is crucial for keeping your business and brand not just afloat, but sailing ahead.
At Marketing Insider Group, we’ve sifted through the noise to bring you over 300 of the most insightful and relevant marketing stats. Covering everything from the nitty-gritty of content marketing to the expansive world of digital ads, these stats are your compass to navigate the marketing seas.
We’ve sorted these statistics into clear, relevant categories, capturing the essence of digital marketing and consumer trends. Our spotlight shines on the freshest data from the recent years, peppered with some evergreen insights, ensuring your marketing strategy remains both current and informed.
So, let’s jump right in and explore these 300+ digital marketing stats to supercharge your marketing strategy.
Content Marketing Stats
- 84% of digital marketing leaders acknowledge the role of AI in enhancing personalization. (Zippia)
- 82% of marketers report that AI significantly influences their content creation plans. (Hubspot)
- 79% of companies have observed revenue growth in marketing and sales due to AI. (Zippia)
- 76% of marketers using generative AI apply it for basic content creation and copywriting tasks. (Insider Intelligence)
- 61% of marketers consider AI a crucial component of their data strategy. (Forbes)
- 93% of online experiences start with a search engine. (DemandSage)
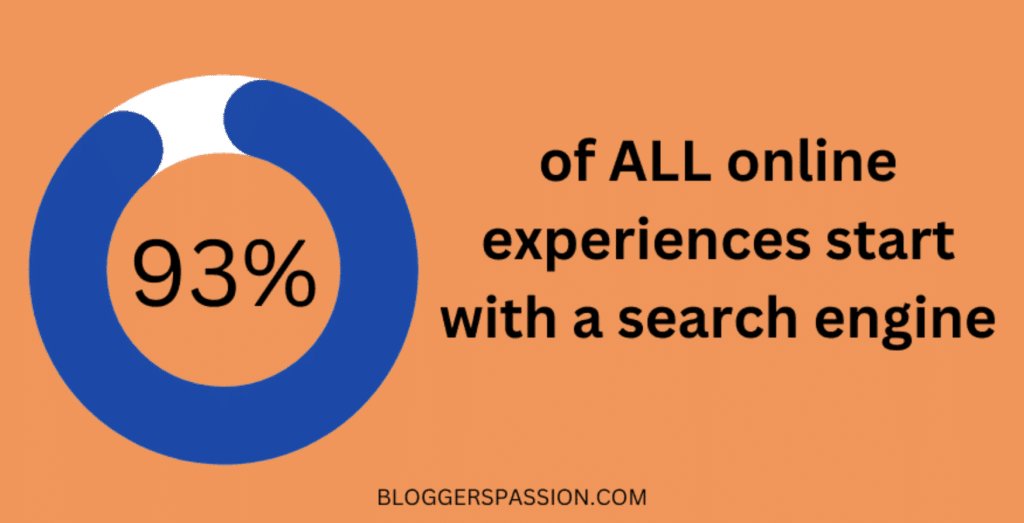
Image Source: Bloggers Passion
- 88% of marketers plan to increase or maintain their investment in SEO. (Hubspot)
- 75% of marketers recognize SEO as their most effective content strategy. (Semrush)
- 75% of users don’t look beyond the first page of search results. (DemandSage)
- 49% of marketers believe organic search yields the best ROI. (Search Engine Journal)
- 97% of marketers incorporate customer data into their decision-making process. (Statista)
- 80% of businesses deem personalization as essential for growth. (Adobe)
- 80% of consumers are more inclined to purchase from companies offering personalized experiences. (Slideshare)
- 80% of marketers using audience segmentation report a rise in sales. (NotifyVisitors)
- Marketers utilizing buyer personas achieve 73% higher conversion rates. (Startups Magazine)
- Over 90% of brands utilize social media for marketing. (Engati)
- 76% of social media users have bought items they saw on social platforms. (Forbes)
- 73% of marketers find social media to be effective for their business. (Zippia)
- 60% of TikTok’s audience comprises Gen Z users. (Wallaroo)
- Social media advertising spending is expected to surpass $300 billion in 2024. (Statista)
- 97% of marketers using Account-Based Marketing (ABM) report it delivers higher ROI than other marketing activities. (WARC)
- 94% of B2B marketers implement ABM strategies. (WebFX)
- 80% of marketers plan to augment their ABM budgets. (LinkedIn)
- An ABM strategy can boost marketing revenue by 208%. (WARC)
Blogging Stats
- The internet hosts over 600 million active blogs. (Growth Badger)
- A majority of bloggers, over 50%, fall within the age range of 21 to 35 years. (Truelist)
- Blog posts are the leading content format, utilized by 90% of marketers for achieving content objectives. (SEMrush)
- The U.S. alone boasts approximately 32 million bloggers as of 2022. (Statista)
- Daily, the internet sees the publication of more than 2 million blog posts. (Hosting Tribunal)
- Food blogs lead in popularity, with 42.8% having over 50,000 monthly sessions, followed by lifestyle (13.3%) and travel (10%). (RankIQ)
- 80% of online users engage with blogs and social media sites. (DemandMetric)
- Nearly 60% of marketers recognize the value of blogging. (DemandMetric)
- Websites with active blogs have 434% more indexed pages and 97% more inbound links compared to those without blogs. (BKA Content)
- Businesses that maintain blogs generate 67% more monthly leads than those without blogs. (DemandMetric)
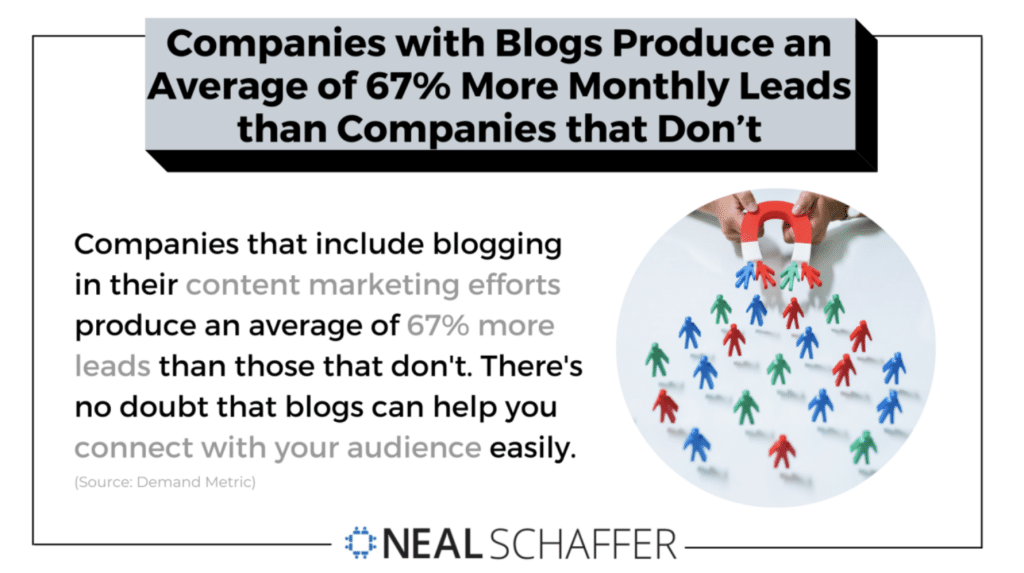
Image Source: Neal Schaffer
- Blogging ranks as the third most prevalent content marketing strategy after video and eBooks. (HubSpot)
- 80% of bloggers affirm that blogging contributes to significant marketing success. (Orbit Media)
- 90% of businesses employ content marketing tactics like blogging. (DemandMetric)
- Companies that blog attract 55% more website visitors than non-blogging companies. (HubSpot)
- On average, bloggers incorporate 2-3 images in each post. (Orbit Media)
- 88% of bloggers who gate content see some or strong results, with 35% reporting strong results. (OrbitMedia)
- Bloggers using 7 or more images per post are 2.3 times more likely to achieve strong results. (OrbitMedia)
- 70% of consumers prefer learning about a company through articles over advertisements. (DemandMetric)
- In 2022, writing a typical blog post took bloggers an average of 4 hours and 10 minutes, an increase from 3 hours and 57 minutes in 2019.
- Original visuals like infographics are considered the most effective by 40% of content marketers. (Venngage)
- The average length of a blog post is 1,376 words. (Orbit Media)
- Listicles are often cited as the most popular blog post format by business bloggers. (HubSpot)
- B2B blog posts are generally 12% longer than non-B2B posts. (Orbit Media)
- Blog posts featuring videos see a fourfold increase in engagement metrics. (Orbit Media)
- 88% of marketers incorporate visuals in more than half of their blog articles. (Venngage)
- Bloggers who publish 2-6 times per week are 50% more likely to report strong results. (Orbit Media)
- 52% of bloggers find engaging with readers through content increasingly challenging. (Orbit Media)
- Producing original visuals consistently is a struggle for 35% of content creators, despite its effectiveness. (Venngage)
- 43% of readers admit they only skim through blog posts. (HubSpot)
- B2B bloggers spend on average 26% more time on each post compared to B2C bloggers. (Orbit Media)
- The average human attention span has reduced from 12 seconds to 8.25 seconds over the past two decades. (Golden Steps ABA)
SEO and Organic Search Stats
- Google processes approximately 7 billion searches daily, equating to about 81,000 searches per second. (Worldometers)
- 21% of search engine users click on more than one result. (Moz)
- A staggering 90.63% of content receives no traffic from Google. (Ahrefs)
- In the US, 53% of people research products using search engines before making a purchase. (Google)
- Over 25% of users click on the first Google search result. (Search Engine Journal)
- Google drives 59.2% of global web traffic. (Sparktoro)
- The first five organic search results account for 67.6% of all clicks. (Up Inc)
- Google dominates nearly 86% of the global search engine market. (Statistica)
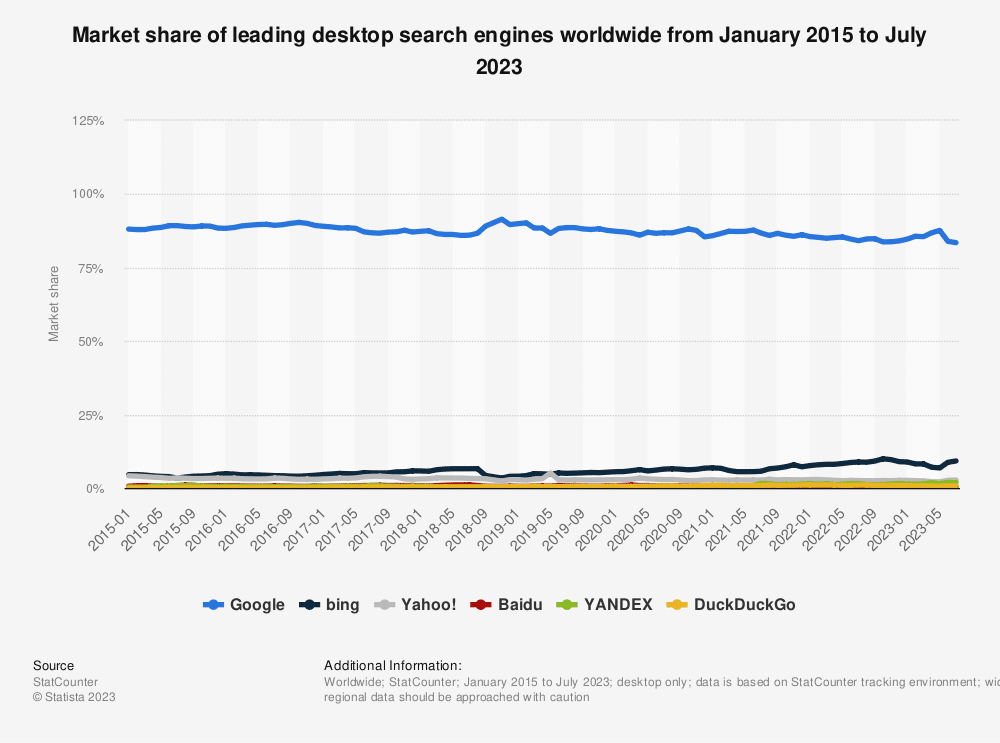
Image Source: Statistica
- The top organic search result is 10 times more likely to receive a click compared to the 10th result. (Backlinko)
- 84% of search engine users turn to Google three or more times daily. (Oberlo)
- Google holds almost 85% of the total global search market. (Statistica)
- Organic search results on Google’s first page typically have an average word count of 1,447. (Backlinko)
- 49% of marketers agree that organic search offers the best ROI among all marketing channels. (Search Engine Journal)
- Google uses over 200 factors in its website ranking algorithm. (Backlinko)
- 30% of mobile searches are related to a specific location. (Think With Google)
- 46% of Google search queries show local intent. (LinkedIn)
- 72% of consumers who conducted a local search visited a business within 5 miles. (HubSpot)
- 97% of people learn about local businesses online more than anywhere else. (SEO Tribunal)
- 72% of desktop/tablet users and 67% of mobile users prefer ads tailored to their location. (Think With Google)
- Approximately 80% of consumers use search engines for local information. (Think With Google)
- 88% of mobile searches for local businesses result in a visit to the store within a week. (Think With Google)
- Following a local mobile search, 76% of individuals visit the business within a day, and 28% of these searches lead to a purchase. (Think With Google)
- About 94% of keywords receive 10 or fewer monthly searches. (Ahrefs)
- 8% of all search queries are phrased as questions. (Moz)
- Half of all searches contain four or more words. (WordStream)
- Approximately 15% of Google searches are unique and have never been searched before. (Google)
- 95% of the entire keyword database gets less than 10 searches per month. (Ahrefs)
- More than 29% of keywords with 10,000 monthly searches consist of three or more words. (Ahrefs)
- 94% of link builders prioritize link quality over quantity. (Authority Hacker)
- The presence of more backlinks increases the likelihood of receiving organic search traffic. (Ahrefs)
- Roughly 74% of link builders create fewer than 10 links per month. (Authority Hacker)
- The top-ranked Google search result typically has about 3.8 times more backlinks than other pages. (Backlinko)
- 95% of all pages have no backlinks. (Backlinko)
- Sites with a blog receive 97% more backlinks. (HubSpot)
- Around 66% of pages have no backlinks. (Ahrefs)
Voice Search Stats
- Over 40% of voice search results come from featured snippets. (Brafton)
- The average voice search result page loads in 4.6 seconds. (Brafton)
- 58% of consumers utilize voice search to find local businesses online. (Forbes)
- Google Assistant is compatible with 30,000 smart home devices. (Statista)
- 45.1% of voice assistant users show a preference for Apple’s Siri. (Voicebot)
Marketing Analytics Stats
- Only 1.9% of marketing executives believe their businesses have the skills to utilize marketing analytics effectively. (HBR)
- 72% of marketers consider content crucial for improving client retention. (Mailchimp)
- Google Analytics allows cross-platform data analysis and can reduce reporting time by 50%. (Mailchimp)
- Leading marketers are 72% more likely to invest in improving the quality/volume of first-party data they collect. (ThinkWithGoogle)

Image Source: Think With Google
- Over 70% of people describe themselves as channel-agnostic, flexible about buying offline or online. (Martech)
- Digital marketing accounts for nearly 60% of marketing spending, as per the AMA’s 2021 CMO survey. (Martech)
- The US Bureau of Labor Statistics forecasts a 10% annual increase in employment for marketing managers over the next eight years. (UChicago)
- An average of 99,800 openings for market research analysts is projected each year over the decade. (UChicago)
- 57% of marketers likely draw incorrect conclusions by misinterpreting data. (MarketingEvolution)
- 66% of marketers find data analytics vital, and 63% agree on the importance of data literacy. (MarketingEvolution)
- 76% of marketing leaders base decisions on data analytics. (MarketingEvolution)
- 37% of marketers find demonstrating the value of marketing analytics as one of their top challenges. (MarketingEvolution)
- Leaders are 53% more likely to believe machine learning aids in analyzing consumer intentions. (MarketingEvolution)
- Marketers allocate 15.9% of their advertising budget to branding. (MarketingEvolution)
- Marketing analytics is the most significant investment, accounting for 16% of annual expenditures. (MarketingEvolution)
- Paid search comprises about 39% of a company’s total marketing budget. (MarketingEvolution)
- 37% of respondents in Gartner’s survey find manual data gathering a hindrance to team effectiveness. (MarketingEvolution)
- 32% of marketers consider competition and marketing analytics crucial for their initiatives. (MarketingEvolution)
- 57% of marketing research analysts hold a bachelor’s degree, and 39% have a master’s degree. (MarketingEvolution)
- The demand for market research analysts is expected to grow 22% from 2020 to 2030. (MarketingEvolution)
- Over 80% of marketers report that their decisions are now predominantly data-informed. (SAS)
- Smartphone analytics predict a 25% increase in mobile traffic by 2025, according to the Ericsson Mobility Report. (SmartInsights)
- Leading marketers are 1.6 times more likely to attribute greater company success to open data availability. (ThinkWithGoogle)
- The employment of market research analysts is projected to grow 19% from 2021 to 2031. (UChicago)
Audio and Podcast Marketing Stats
- The podcast industry is currently worth $23.56 billion. (Demand Sage)
- An average American listens to 8 podcasts every week. (Demand Sage)
- Over 62% of American consumers listen to podcasts. (Statista)
- There are currently 464.7 million podcast listeners globally. That is 8.68% of the total internet users (Demand Sage)
- Experts predict that the number of podcast listeners will reach 504.9 million by the end of 2024. (Demand Sage)
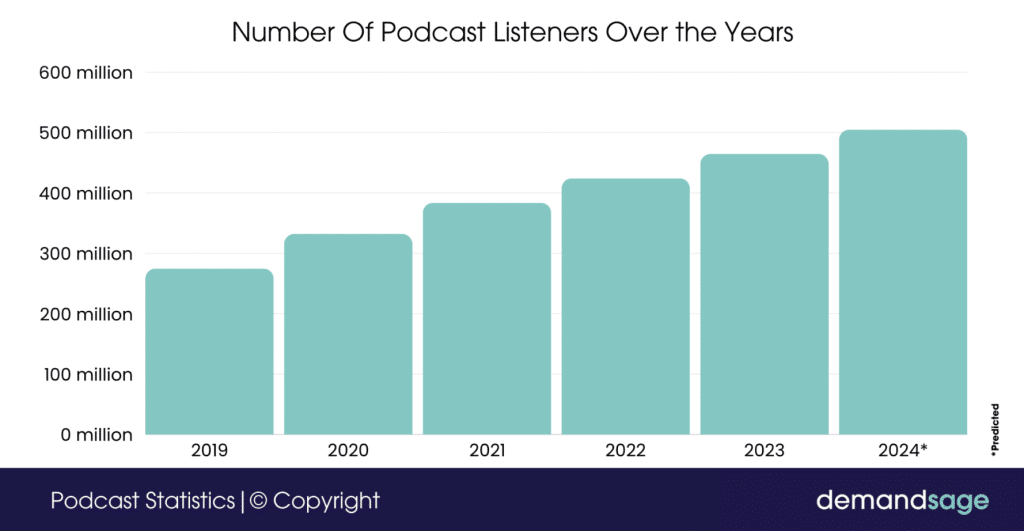
Image Source: Demand Sage
- 84% of podcast advertisements are dynamic. (Spiralytics)
- 82% of marketers plan to maintain or increase their podcast investments. (Hubspot)
Video Marketing Stats
- 91% of consumers express a desire for more online videos from brands. (Hubspot)
- 91% of brands incorporate video as a marketing tool. (Hubspot)
- 90% of marketers credit video with aiding in lead generation. (Wyzowl)
- In 2023, online videos accounted for 82.5% of all internet traffic. (DemandSage)
- 87% of marketers report a direct, positive impact on sales from video marketing. (Wyzowl)
- 72% of customers would rather watch a video than read about a product (Gitnux)
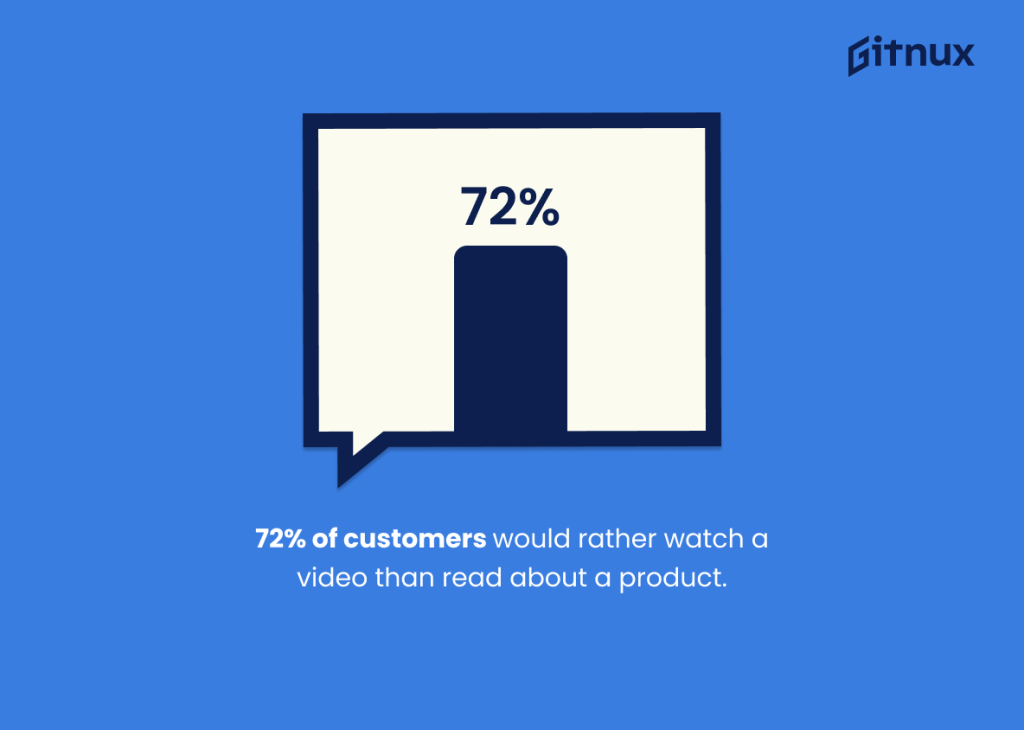
Image Source: Gitnux
- Websites with video content are 53x more likely to rank on page one of Google SERPs. (Gitnux)
- 85% of Facebook users watch videos with the sound off. (Gitnux)
- YouTube mobile video consumption grows by 100% every year. (Gitnux)
- 89% of people say watching a video has convinced them to buy a product or service. (Demand Sage)
- The average user spends 88% more time on websites that have videos. (Demand Sage)
- 85% of internet users in the United States watch online video content. (Demand Sage)
- YouTube is the most widely used video marketing platform, with 90% of video marketers using it. (Demand Sage)
- Only 36% of marketers have published ‘live’ video content, such as live streams on social media channels. (Demand Sage)
Webinar Marketing Stats
- 95% of businesses consider webinars a crucial part of their marketing strategy. (On24)
- 73% of B2B companies view webinars as the best method to generate high-quality leads. (GoTo)
- 76% of webinars are primarily focused on generating leads and sales. (On24)
- 60% of businesses use webinars for nurturing loyal customers. (On24)
- 61% of companies employ webinars as a content marketing tactic. (Content Marketing Institute)
- 73% of B2B webinar attendees typically convert to leads. (WebinarCare)
- In the B2C sector, only 20%-40% of webinar attendees convert. (WebinarCare)
- Hosting a webinar costs between $100 and $3000 on average. (WebinarCare)
- Tuesdays, Wednesdays, and Thursdays are the most effective days to host webinars. (Live Webinar)
- The best times to host a webinar are 11 AM and 2 PM. (GoTo)
- 44% of webinar attendees prefer a duration of 45 minutes. (BigMarker)
- 41% of attendees feel that 30 minutes is the ideal webinar runtime. (BigMarker)
- Only 44% of those who pre-register for webinars actually attend. (BigMarker)
- Educational webinars are the most popular type. (WebinarCare)
- On-demand viewing options are highly valued in webinars. (BrightTalk)
- 60% of webinar registrations occur via email. (WebinarCare)
- 80% of B2B marketers use their websites to drive webinar registrations. (Statista)
- 29% of people register for webinars on the same day they take place. (WebinarCare)
- Only 15% of attendees register for webinars 15 days or more in advance. (WebinarCare)
- The optimal length for webinar registration forms is 5-6 pages. (WebinarCare)
- 92% of attendees find Q&A sessions at the end of webinars beneficial. (BigMarker)
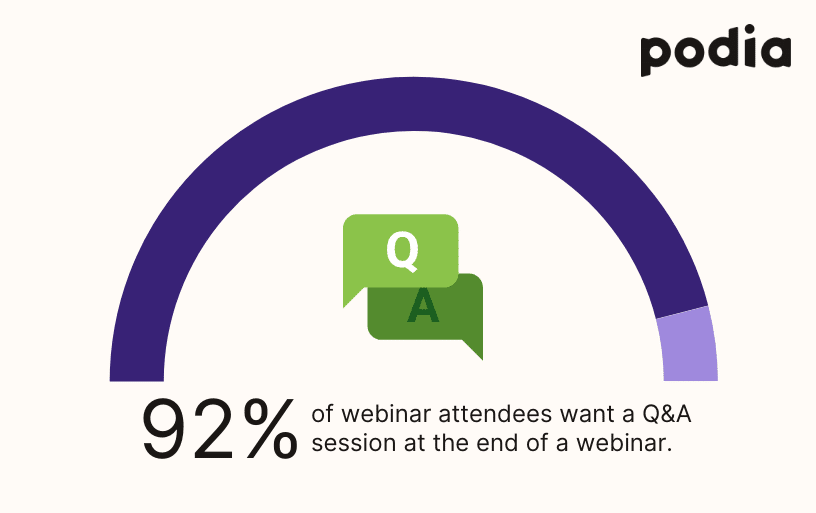
Image Source: Podia
Conversion Rate Optimization (CRO) Stats
- The average conversion rate across all industries is 2.9%. (Ruler Analytics)
- Professional services have the highest conversion rate at 4.6%. (Ruler Analytics)
- B2B Ecommerce has the lowest conversion rate at 1.8%. (Ruler Analytics)
- Direct traffic sources have an average conversion rate of 3.3%. (Ruler Analytics)
- Paid search has an average conversion rate of 3.2%. (Ruler Analytics)
- Referral traffic converts at an average rate of 2.9%. (Ruler Analytics)
- Organic search has an average conversion rate of 2.7%. (Ruler Analytics)
- Email campaigns convert at an average rate of 2.6%. (Ruler Analytics)
- Social media has the lowest average conversion rate at 1.5%. (Ruler Analytics)
- A/B testing landing page designs increases conversions by 12%. (VWO)
- User-generated content increases conversions by 8.5%. (PowerReviews)
- Lead generation landing pages have an average conversion rate of 11.9%. (Unbounce)
- Long-form landing pages increase conversion rates by 52%. (Conversion Rate Experts)
- The average median conversion rate for click-based campaigns is 11.3%. (Unbounce)
Email Marketing Stats
- In 2020, there were four billion global email users, expected to grow to 4.6 billion by 2025. (Statista)
- Small business owners rank email marketing as the second most important medium for brand awareness after social media marketing. (Campaign Monitor)
- 47% of marketers consider email their most effective marketing channel. (GetResponse)
- Gmail is the most popular email platform with over 1.8 billion monthly users. (Techjury)
- 43% of US respondents check their work emails outside business hours. (Statista)
- 49% of consumers prefer to receive weekly promotional emails from favorite brands. (Statista)
- The average email subject line contains 43.85 characters. (AWeber)
- Including the word “video” in email subject lines increases open rates by 19% and click-through rates by 65%. (Syndacast)
- Only 6.9% of email subject lines analyzed included emojis. (AWeber)
- Including videos in emails can increase click rates by up to 300%. (Martech Advisor)
- Emails ending with “Thanks in advance” receive higher response rates. (Boomerang)
- 75% of email signatures include contact information. (MarTech)
- The average open rate for email newsletters across all industries is 21.33%. (Mailchimp)
- Friday has the highest email open (18.9%) and click-through rates (2.7%). (Campaign Monitor)
- Government and Non-profit sectors receive the highest email open rates. (Campaign Monitor)
- Plain-text emails perform better than image-based HTML emails. (Hubspot)
- 63% of people open emails to find discounts. (Media Post)
- Welcome emails have the highest open rates (91.43%) and an average CTR of 26.9%. (Hive)
- The average click-to-open rate for all industries is 14.1%. (Campaign Monitor)
- Approximately 347.3 billion emails were sent and received per day in 2023, projected to reach 408.2 billion by 2027. (The Radicati Group)
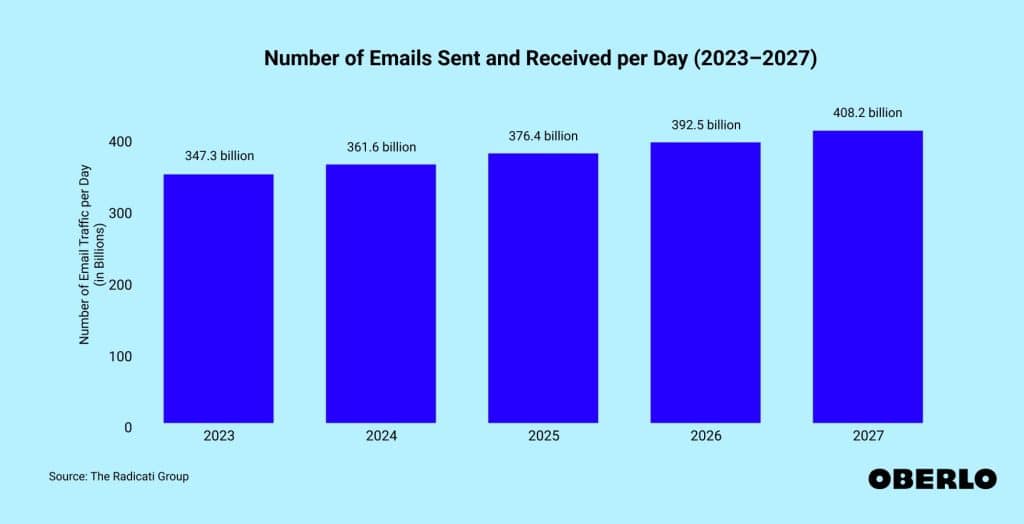
Image Source: Oberlo
- 11.1% of all emails face deliverability issues. (EmailToolTester)
- The average email deliverability rate is 88.9%. (EmailToolTester)
Social Media Marketing Stats
- More people discover new brands, products, and services via social media ads than by other means. (DataReportal)
- Social media ads are the top source of new brand discovery for internet users aged 16-24. (DataReportal)
- The top three social media channels based on potential ad reach in the United States are Facebook (188,050,000), Instagram (161,700,000), and TikTok (150,000,000+). (DataReportal; TikTok)
- The average click-through rate (CTR) for a social media ad is 1.36%. (Statista)
- Social media ad spending is projected to reach $207.1 billion. (Statista)
- The average U.S. social media buyer is projected to spend $779 via social networks, increasing to $937. (Insider Intelligence)
- There are 4.88 billion social media user identities, equating to 60.6% of the population. (DataReportal)
- Social media users are currently growing at a rate of 9.6 new users every second. (DataReportal)
- The average social media user spends 2 hours and 24 minutes using social media every day. (DataReportal)
- The average social media user uses 6.7 platforms per month. (GWI/DataReportal)
- Facebook has the largest reach of all social media advertising platforms in the U.S., with 188,050,000 users. (DataReportal)
- Only 25% of users access Facebook via laptop or desktop. (Khoros)
- 40% of Facebook advertisers use the Click-to-Messaging format. (Meta)
- Instagram has the second largest reach of all social media advertising platforms in the U.S., with 161,700,000 users. (DataReportal)
- An estimated 71% of U.S. businesses have Instagram accounts. (Khoros)
- Over 200 million businesses use Instagram’s advertising platform. (Instagram)
- On average, Instagram users spend 30.1 minutes per day on the platform. (Khoros)
- 83% of users say they discover new products and services on Instagram. (Khoros)
- 61% of Instagram’s advertising audience is age 18 to 34. (Statista)
- Less than 7% of Instagram’s advertising audience is over 55. (Statista)
- X ads have a potential reach of 528.3 million active users. (X)
- The average X user spends 34.8 minutes per day on the platform. (Khoros)
- 64.3% of X’s ad audience identifies as male and 35.7% as female. (Kepios)
- 82% of B2B businesses use X. (Khoros)
- 77% of X users have a better impression of a brand when they respond to a post. (Khoros)
- Ad engagement on X increased by 32% YoY. (Khoros)
Lead Generation & Nurturing Stats
- 65% of businesses say generating traffic and leads is their biggest marketing challenge. (HubSpot)
- 93% of B2B companies say content marketing generates more leads than traditional marketing strategies. (Marketo, Forbes)
- 93% of B2B buying processes start with an online search. (Pinpoint Market Research and Anderson Jones PR)
- 96% of visitors who come to your website aren’t ready to buy. (Marketo)
- 68% of B2B companies will use landing pages to nurture new sales leads for future conversion. (Marketing Sherpa)
- B2C companies that blog 11+ times per month get more than 4X as many leads than those only blogging 4-5 times per month. (HubSpot)
- 74% of companies say converting leads into customers is their top priority. (HubSpot)
- 48% of businesses say most of their leads require “long cycle” nurturing with many influencers. (Ascend2)
- 54% of email marketers say increasing engagement rate is their number one priority. (Ascend2)
- Targeting users with content relevant to their position along the buying process yields 72% higher conversion rates. (Aberdeen)
- 51% of email marketers say email list segmentation is the most effective way to personalize lead nurturing. (Ascend2)
- 34.1% of businesses don’t use any attribution model to measure marketing performance. (Bizible)
- Only 29% of brands nurture their existing customers beyond the initial purchase. (Demand Gen)
- 85% of marketers say lead generation is their most important content marketing goal. (ZipDo)
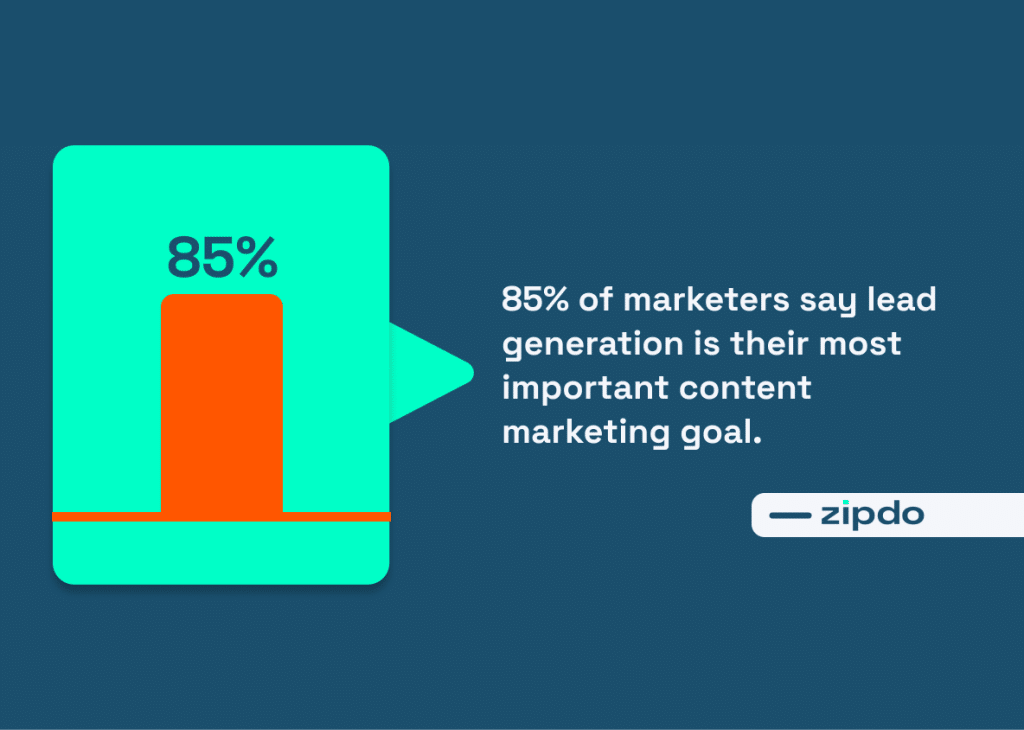
Image Source: ZipDo
- 57% of marketers say lead nurturing is the most valuable feature of automation software. (Ascend2)
- 79% of top-performing companies have been using marketing automation for three or more years. (Pardot)
- The biggest benefits of automation are saving time (74%), increased customer engagement (68%), more timely communications (58%), and increased opportunities including up-selling (58%). (Adestra)
- 91% of users believe marketing automation is “very important” to successfully marketing across multiple channels. (Marketo)
- 80% of marketers using automation software generate more leads; 77% convert more of those leads. (VB Insight, APSIS)
- 58% of best-in-class marketing automation users say the most useful metrics for measuring performance are Conversion Rate and Revenue Generated. (Ascend2)
- 63% of companies using marketing automation outsource all or part of it. (Ascend2)
Marketing Automation Stats
- The global marketing automation market is projected to reach $13.71 billion by 2030. (Polaris)
- Hubspot leads the marketing automation software market with a 37.5% market share. (Datanyze)
- Global programmatic advertising spending is projected to reach $724.84 billion by 2026. (Statista)
- 76% of businesses use marketing automation. (Hubspot)
- 10% of customer journeys are fully automated. (Ascend2)
- Using automation to optimize overall strategy is the top goal for marketers. (Ascend2)
- 59% of marketers foresee an increase in automation budgets. (Ascend2)
- 91% of companies say demand for automation has increased. (Salesforce)
- Pricing is the most important factor when choosing a marketing automation tool. (MarketingCharts)
- 91% of marketers say marketing automation helps them achieve their objectives. (Ascend2)
- Improved targeting is the top perceived benefit of marketing automation. (Liana)
- Marketers who use automation are 46% more likely to report having an effective marketing strategy. (Hubspot)
- Marketing automation improves collaboration between sales and marketing. (MarketingCharts)
- Insufficient training and knowledge is the biggest barrier to fully adopting marketing automation tools. (MarketingCharts)
- Marketing professionals say lack of expertise is their top automation challenge. (Liana)
- Email marketing is the most automated marketing channel. (Ascend2)
- 18% of companies use automation as their primary email marketing tactic. (Hubspot)
- Automated emails generate 31% of all email orders. (Omnisend)
- 48% of email marketers hope to increase automation. (MarketingCharts)
- Onboarding and post-purchase emails are the most common email sequences marketers automate. (Litmus)
- Automation is the 3rd most effective email marketing strategy. (Hubspot)
Customer Experience Stats
- The customer experience management market is currently valued at $12.04 billion. (Grandview Research)
- The CX personalization & optimization software and services market is projected to reach $11.6 billion by 2026. (Dash Research)
- 81% of marketers expect to compete primarily on customer experience in the next two years. (MarketingEvolution)
- 88% of customers say the experience a company provides is as important as its products or services. (Salesforce Research)
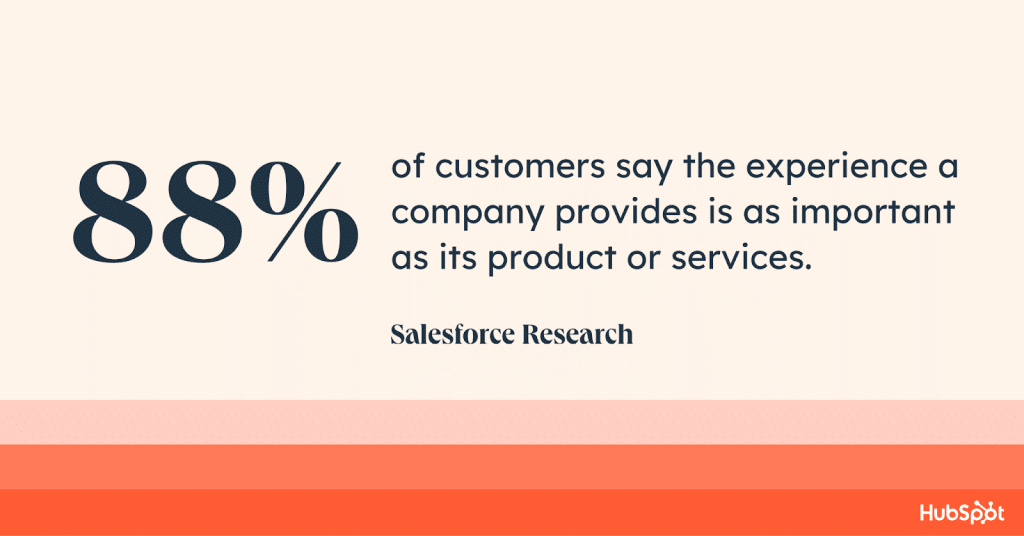
Image Source: HubSpot
- 3 in 4 American shoppers say customer experience is the deciding factor when choosing between competing brands. (PwC)
- As many as 86% of consumers claim they would leave a brand after 2-3 bad customer service experiences. (Emplifi)
- Consumers will pay up to a 16% price premium for a positive customer experience. (PwC)
- 3 in 4 customers expect consistent interactions across sales, service, and marketing departments. (Salesforce)
- 62% of customers say their experience in one industry affects their expectations of other industries. (Salesforce)
- 64% of consumers want chatbots to provide the same quality of service as a human customer service agent. (Zendesk)
- For 80% of buyers, speed of delivery is a prime factor in customer experience. (PwC)
- Customers are 2.4x more likely to remain loyal to brands that quickly solve customer service issues. (Forrester)
- Around 4 in 5 consumers are willing to share personal data in exchange for better customer experiences. (PwC)
- 60% of consumers say they’ll become repeat buyers after a personalized experience. (Twilio)
- Customer experience is the top 5-year priority for 45.9% of businesses. (SuperOffice)
- 41% of “customer-obsessed” companies achieved a 10% or greater revenue growth. (Forrester)
- CX programs that exceed management expectations are almost twice as likely to use customer personas. (Gartner)
- Reducing customer effort is the top driving principle behind customer journey design strategy. (NTT)
- 45% of organizations regard CX as a top 3 performance indicator. (NTT)
- Predicting customer needs and behavior is the primary way brands are using AI in customer experience. (MarketingCharts)
- 70% of CX leaders struggle to increase customer loyalty. (Gartner)
- Around 9 in 10 brands think they are providing “good enough” customer experiences. (IDC, Emplifi)
- 60% of customers disagree that brands are providing a good customer experience. (IDC, Emplifi)
- Over half of businesses think their customers are satisfied with their self-service options, yet only 15% of customers agree. (NICE)
- Brands that deliver great customer experiences can achieve revenue growth 4-8% higher than the industry average. (Bain)
Ecommerce & Online Shopping Stats
- By 2026, 24% of retail purchases are expected to take place online. (Statista)
- By 2026, the Ecommerce market is expected to total over $8.1 trillion. (eMarketer)
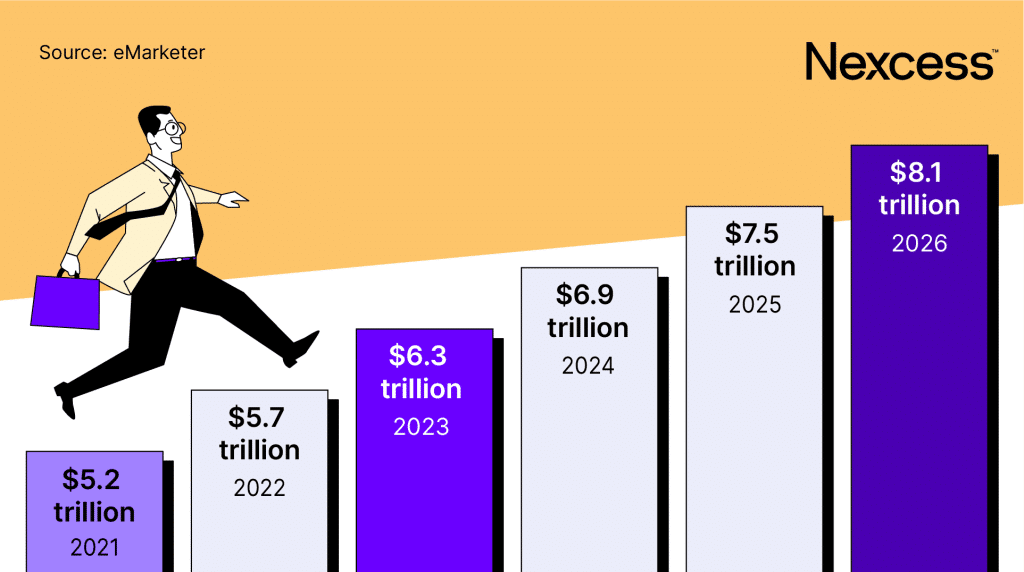
Image Source: Nexcess
- The U.S. Ecommerce market will reach over $1.1 trillion in sales in 2023. (Intuit)
- In the U.S., 16.4% of retail purchases are expected to take place online in 2023. (Digital Marketing Institute)
- Amazon accounts for 37.8% of Ecommerce sales, the highest market share of all Ecommerce companies. (PewResearch)
- Walmart, eBay, and AliExpress are the most visited Ecommerce websites. (Adobe Analytics)
- 57% of online shoppers report shopping internationally. (National Retail Federation)
- The most common reason online shoppers abandon their cart is because of additional costs like shipping, taxes, and fees (48%). (Statista)
- 24% of online shoppers abandon their cart because the site wanted them to create an account. (SEMrush)
- 22% drop out of an online shopping session because shipping is too slow. (Paypal)
- 79% of shoppers shop online at least once a month. (IPC)
- The online shopping cart abandonment rate on mobile devices is 84%. (Intuit)
- The online shopping cart abandonment rate on desktops is 72%. (Digital Marketing Institute)
- Social media commerce is expected to reach $2.9 trillion by 2026. (Adobe Analytics)
- 96.9 million people in the United States shop on social media. (National Retail Federation)
- Millennials shop on social media the most—55% of people aged 18 to 24 in the United States have made a purchase on social media. (Insider Intelligence)
- China has the highest rate of social commerce shoppers—nearly 50% have purchased from social networks. (Statista)
- Facebook is the most popular social media platform for social commerce transactions. (SEMrush)
- 40% make a purchase because of social media influence. (Paypal)
- 49% of social commerce shoppers have had an influencer’s recommendation impact their purchase. (IPC)
- 91% make online purchases using their smartphone. (Intuit)
- Mobile commerce sales are expected to account for 6% of all retail sales in 2023. (Digital Marketing Institute)
- Mobile commerce accounted for more than $360 billion in sales in 2021. (PewResearch)
- Mobile commerce sales are expected to account for $710 billion in commerce sales by 2025. (Adobe Analytics)
- Tablet m-commerce sales are expected to reach $54.01 billion by 2026. (National Retail Federation)
Embrace the Future of Marketing Today with MIG
It’s clear that the future of marketing is both dynamic and exciting. These 300+ statistics offer a glimpse into the evolving trends and strategies that are shaping the way we connect with audiences.
Remember, staying informed and adaptable is key in this fast-paced world. Use these insights to refine your strategies, experiment with new ideas, and boldly embrace the opportunities that lie ahead.
Ready to embrace the future of marketing? Check out our SEO Blog Writing Service or schedule a quick consultation to learn more about how Marketing Insider Group can help you earn more leads for your business.

